. 2009 Mar 20;387(1):28-41.
doi: 10.1016/j.jmb.2009.01.055. Epub 2009 Jan 31.

Sequence-specific binding to a subset of IscR-regulated promoters does not require IscR Fe-S cluster ligation

Affiliations

Sequence-specific binding to a subset of IscR-regulated promoters does not require IscR Fe-S cluster ligation

A D Nesbit et al. J Mol Biol. .

Abstract

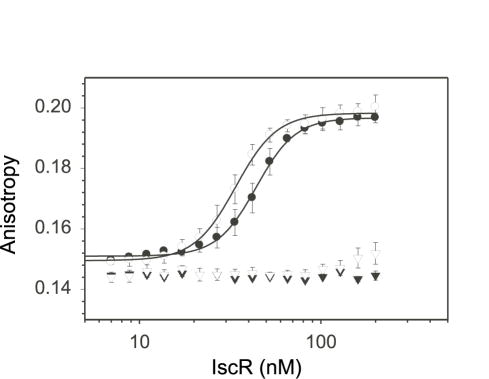
IscR is an Fe-S protein that functions as a transcriptional regulator of Fe-S biogenesis and other Fe-S protein-encoding genes in Escherichia coli. In this study, we investigated the requirement for the ligation of the [2Fe-2S] cluster of IscR to regulate a subset of IscR target promoters (P(hyaA), P(ydiU), P(napF), and P(hybO)) and defined the requirements for sequence-specific binding to the IscR target site in the hyaA promoter region. In contrast to previous results with the iscR promoter, we found that the Fe-S cluster is dispensable for IscR regulation of P(hyaA), P(ydiU), P(napF), and P(hybO), since IscR mutants containing alanine substitutions of the cysteine Fe-S ligands retained IscR-dependent regulation of these promoters in vivo. In vitro assays showed that both [2Fe-2S]-IscR and an IscR mutant lacking the cluster (IscR-C92A/C98A/C104A) bound the hya site with similar affinity, explaining why the mutant protein retained its ability to repress P(hyaA) in vivo. Characterization of the oligomeric state of IscR showed that both apo-IscR and [2Fe-2S]-IscR were dimers in solution, and four protomers of either form bound to the hya site. Also, binding of either apo- or [2Fe-2S]-IscR to the hya site showed cooperativity, suggesting that both forms interact similarly with the target site. Analysis of mutations in the hya site using DNA competition assays showed that apo-IscR most likely recognizes an imperfect palindrome within the hya promoter. Furthermore, the strength of apo-IscR binding to P(sufA), P(ydiU), P(napF), and P(hybO) IscR sites correlated with the number of matches to the hya site bases shown to be important in the competition assay. Thus, our data indicated that, unexpectedly, apo-IscR is a site-specific DNA-binding protein, and the role of apo-IscR needs to be considered in developing models for how IscR globally regulates transcription.


Figures

Figure 1
Figure 1
Diagram of IscR showing the predicted helix-turn-helix motif (http://www.uniprot.org/uniprot/P0AGK8?id=P0AGK8) and a [2Fe-2S] cluster ligation region. Inset is the amino acid sequence of the [2Fe-2S] cluster ligation region with arrows marking the putative cysteine ligand residues.
Figure 2
Figure 2
Expression levels of PsufA (Panel a), PydiU (Panel b), and PhyaA (Panel c) promoters fused to lacZ were determined in strains containing either wild-type IscR (white bars), IscR- (left hash bars), IscR-C92A (right hash bars), IscR-C98A (checked bars), IscR-C104A (horizontal line bars), or IscR-C92A/C98A/C104A (vertical line bars). Strains were grown under aerobic conditions in MOPS minimal media containing 0.2% glucose and were assayed for β-galactosidase activity per O.D.600 (Miller Units, y-axis). Error bars represent data from 3 isolates on a single day. Panel d: Total IscR levels were measured by Western blots and normalized to colony forming units (CFU). Error bars represent 3 samples on various days.
Figure 3
Figure 3
DNA binding isotherms of as-purified wild-type IscR (open symbols) and IscR-C92A/C98A/C104A (closed symbols). Protein preparations (7 to 200 nM) were incubated with either 5 nM fluorescently-labeled DNA containing the IscR hya site (circles) or 5 nM randomized site (triangles) in 40 mM Tris-Cl (pH 7.9) and 150 mM KCl. Protein binding to DNA is indicated by changes in anisotropy values (y-axis). Error bars represent assays done 3 separate days.
Figure 4
Figure 4
Panel a) Determination of molecular mass of IscR by size exclusion chromatography. The molecular mass (kDa) of the standards vitamin B12 (1.35 kDa), cytochrome c (12 kDa), myoglobin (17 kDa), carbonic anhydrase (29 kDa), ovalbumin (44 kDa), bovine serum albumin (66 kDa), gamma globin (158 kDa), and thyroglobulin (670 kDa) were plotted as a function of elution volume divided by void volume (Ve/V0). The Ve/V0 of 240 μM [2Fe-2S]- and 970 μM apo-IscR are marked with a dashed line. Panel b) Determination of the molecular mass of IscR by analytical ultracentrifugation. A global fit model (lines) with IscR in equilibrium between a dimer and tetramer was generated from sedimentation equilibrium assays. Every other data point for the 12 (circles) and 49 (squares) μM IscR-C92A/C98A/C104A at 9000 and 19200 rpm in 40 mM Tris-Cl (pH 7.4 at 25°C) and 150 mM KCl was plotted as the natural log of the absorbance as a function of radial position (cm2).
Figure 4
Figure 4
Panel a) Determination of molecular mass of IscR by size exclusion chromatography. The molecular mass (kDa) of the standards vitamin B12 (1.35 kDa), cytochrome c (12 kDa), myoglobin (17 kDa), carbonic anhydrase (29 kDa), ovalbumin (44 kDa), bovine serum albumin (66 kDa), gamma globin (158 kDa), and thyroglobulin (670 kDa) were plotted as a function of elution volume divided by void volume (Ve/V0). The Ve/V0 of 240 μM [2Fe-2S]- and 970 μM apo-IscR are marked with a dashed line. Panel b) Determination of the molecular mass of IscR by analytical ultracentrifugation. A global fit model (lines) with IscR in equilibrium between a dimer and tetramer was generated from sedimentation equilibrium assays. Every other data point for the 12 (circles) and 49 (squares) μM IscR-C92A/C98A/C104A at 9000 and 19200 rpm in 40 mM Tris-Cl (pH 7.4 at 25°C) and 150 mM KCl was plotted as the natural log of the absorbance as a function of radial position (cm2).
Figure 5
Figure 5
Stoichiometry of IscR DNA binding generated from fluorescence anisotropy assays of as-purified wild-type IscR (open symbols) and IscR-C92A/C98A/C104A (closed symbols) (269 to 1000 nM) with 250 nM Texas Red labeled-hya site DNA in 40 mM Tris-Cl (pH 7.9) and 150 mM KCl. Fraction bound (y-axis) was calculated from the anisotropy and is a function of [IscR monomers] divided by [250 nM DNA] (x-axis). Error bars represent assays done 3 separate days.
Figure 6
Figure 6
Representative titration curves generated from the DNA competition assays. Fraction of 5 nM labeled-hya site DNA bound by 55 nM IscR-C92A/C98A/C104A in 40 mM Tris-Cl (pH 7.9), 150 mM KCl and in the presence of 8 to 1000 nM of either unlabeled-wild-type hya site competitor (closed circles), -55(A to C) mutant competitor (closed inverted triangles), or randomized competitor (open circles). Error bars represent assays done 3 separate days.
Figure 7
Figure 7
Expression levels of PhyaA containing mutations in the IscR binding site were determined in strains containing either wild-type IscR (white bars), IscR (left hash bars), or IscR-C92A/C98A/C104A (right hash bars). Strains were grown under aerobic conditions in MOPS minimal media + 0.2% glucose. The β-galactosidase activity per O.D.600 (Miller Units, y-axis) produced from the PhyaA-lacZ was measured as previously described. Error bars represent data from 3 isolates on a single day.
Figure 8
Figure 8
Panel a) Comparison of IscR binding sites to the IscR binding motif with the original \ Type 2 sequence logo as a reference. The number listed after the promoter name is the most upstream base of the IscR site relative to the transcription start site (P3 of PnapF is -121 bp relative to P1 in PnapF2). The IC50 values for each promoter are listed after the sequence. (underlined bases, symmetrical; central base, lowercase; important bases, bold; critical bases, italic) Panel b) Titration curves generated from the competition assays with 55 nM IscR-C92A/C98A/C104A in 40 mM Tris-Cl (pH 7.9), 150 mM KCl, and 5 nM labeled-hya site. The concentration of unlabeled-wild-type hya site competitor (closed circles), sufA site competitor (closed inverted triangles), ydiU site competitor (open inverted triangles), napF site competitor (closed squares), hybO site competitor (open squares), or randomized competitor (open circles) was varied from 8 to 1000 nM. Error bars represent assays done 3 separate days.
Figure 8
Figure 8
Panel a) Comparison of IscR binding sites to the IscR binding motif with the original \ Type 2 sequence logo as a reference. The number listed after the promoter name is the most upstream base of the IscR site relative to the transcription start site (P3 of PnapF is -121 bp relative to P1 in PnapF2). The IC50 values for each promoter are listed after the sequence. (underlined bases, symmetrical; central base, lowercase; important bases, bold; critical bases, italic) Panel b) Titration curves generated from the competition assays with 55 nM IscR-C92A/C98A/C104A in 40 mM Tris-Cl (pH 7.9), 150 mM KCl, and 5 nM labeled-hya site. The concentration of unlabeled-wild-type hya site competitor (closed circles), sufA site competitor (closed inverted triangles), ydiU site competitor (open inverted triangles), napF site competitor (closed squares), hybO site competitor (open squares), or randomized competitor (open circles) was varied from 8 to 1000 nM. Error bars represent assays done 3 separate days.
Figure 9
Figure 9
Expression levels of PnapF (Panel a) or PhybO (Panel b) promoters fused to lacZ were determined in strains containing either wild-type IscR (white bars), IscR- (left hash bars), or IscR-C92A (right hash bars). These strains were grown under aerobic conditions in minimal media, and β-galactosidase activity per O.D.600 (Miller Units, y-axis) was determined. Error bars represent data from 3 isolates on a single day.

Similar articles

Cited by

References

    1. Schwartz CJ, Giel JL, Patschkowski T, Luther C, Ruzicka FJ, Beinert H, Kiley PJ. IscR, an Fe-S cluster-containing transcription factor, represses expression of Escherichia coli genes encoding Fe-S cluster assembly proteins. Proc Natl Acad Sci USA. 2001;98:14895–900. - PMC - PubMed
    1. Giel JL, Rodionov D, Liu M, Blattner FR, Kiley PJ. IscR-dependent gene expression links iron-sulphur cluster assembly to the control of O2-regulated genes in Escherichia coli. Mol Microbiol. 2006;60:1058–75. - PubMed
    1. Johnson DC, Dean DR, Smith AD, Johnson MK. Structure, function, and formation of biological iron-sulfur clusters. Annu Rev Biochem. 2005;74:247–81. - PubMed
    1. Fontecave M, Ollagnier-de-Choudens S. Iron-sulfur cluster biosynthesis in bacteria: Mechanisms of cluster assembly and transfer. Arch Biochem Biophys. 2008;474:226–37. - PubMed
    1. Loiseau L, Gerez C, Bekker M, Ollagnier-de-Choudens S, Py B, Sanakis Y, de Mattos JT, Fontecave M, Barras F. ErpA, an iron-sulfur (Fe-S) protein of the A-type essential for respiratory metabolism in Escherichia coli. Proc Natl Acad Sci USA. 2007;104:13626–31. - PMC - PubMed

Publication types