. 2009 Mar 13;386(5):1204-11.
doi: 10.1016/j.jmb.2009.01.039. Epub 2009 Jan 27.

Electron microscopic evidence in support of alpha-solenoid models of proteasomal subunits Rpn1 and Rpn2

Affiliations

Electron microscopic evidence in support of alpha-solenoid models of proteasomal subunits Rpn1 and Rpn2

Grégory Effantin et al. J Mol Biol. .

Abstract

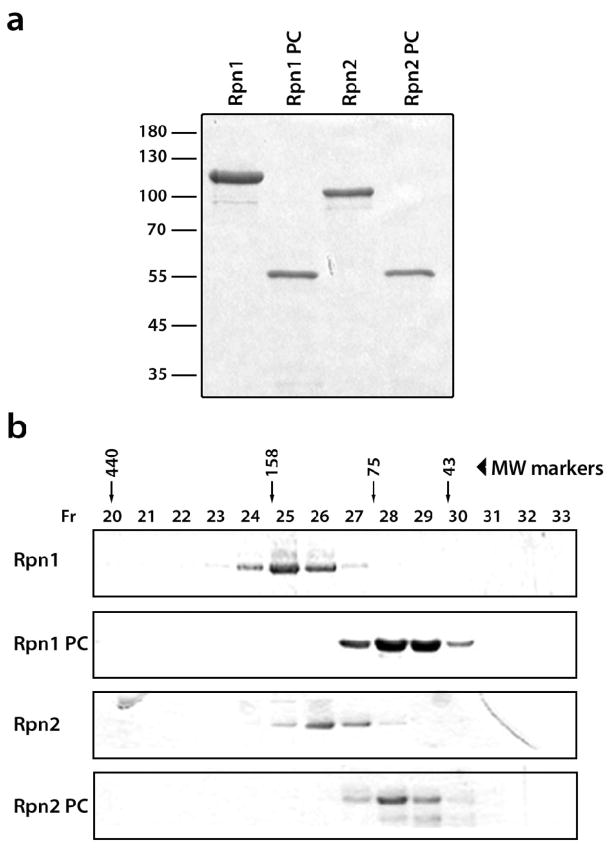
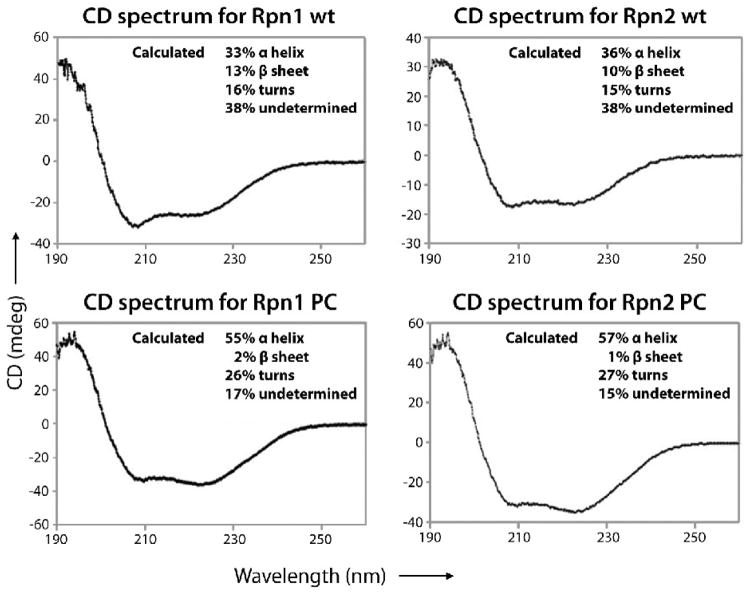
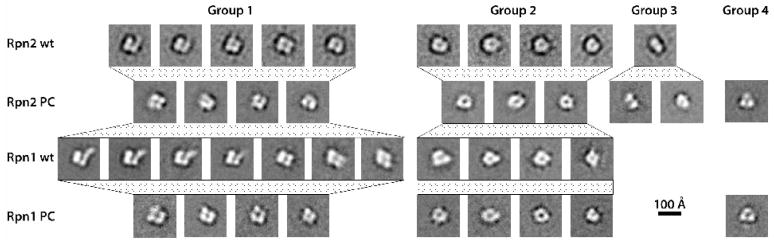
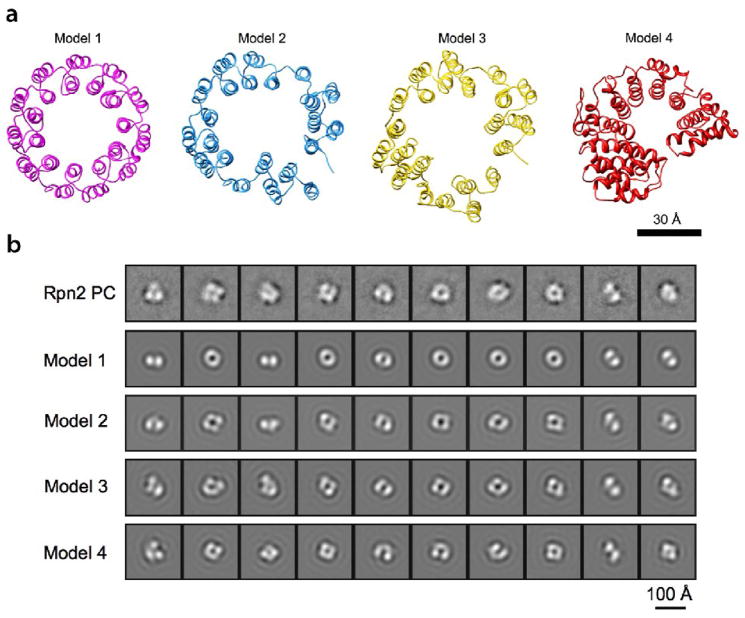
Rpn1 (109 kDa) and Rpn2 (104 kDa) are components of the 19S regulatory complex of the proteasome. The central portions of both proteins are predicted to have toroidal alpha-solenoid folds composed of 9-11 proteasome/cyclosome repeats, each approximately 40 residues long and containing two alpha-helices and turns [A. V. Kajava, J. Biol. Chem. 277, 49791-49798, 2002]. To evaluate this prediction, we examined the full-length yeast proteins and truncated versions thereof consisting only of the repeat-containing regions by gel filtration, CD spectroscopy, and negative-staining electron microscopy (EM). All four proteins are monomeric in solution and highly alpha-helical, particularly the truncated ones. The EM data were analyzed by image classification and averaging techniques. The preponderant projections, in each case, show near-annular molecules 6-7 nm in diameter. Comparison of the full-length with the truncated proteins showed molecules similar in size and shape, indicating that their terminal regions are flexible and thus smeared to invisibility in the averaged images. We tested the toroidal model further by calculating resolution-limited projections and comparing them with the EM images. The results support the alpha-solenoid model, except that they indicate that the repeats are organized not as symmetrical circular toroids but in less regular horseshoe-like structures.


Figures

Fig. 1
Fig. 1
Expression and purification of Rpn1 and Rpn2 and truncated versions thereof. (a) SDS-PAGE (10% gel) of purified recombinant proteins stained with Coomassie Blue: Rpn1 (lane 1), Rpn1PC (lane 2), Rpn2 (lane 3), and Rpn2PC (lane 4). (b) Gel-filtration chromatography of Rpn1 and Rpn2. The purified proteins were loaded separately on a Superdex200 column. Molecular mass standards eluted in fractions 20, 24, 27 and 29. The elution profiles are shown in Supplemental Figure 4. i) Using a calibration chart, the peak of Rpn1 was calculated at a mass of 114.7 kDa (calculated monomer mass, 110 kDa); Rpn1PC eluted at 53.5 kDa (calculated monomer mass, 50 kDa); Rpn2 eluted at 100.1 kDa (calculated monomer mass, 104 kDa); and Rpn2PC eluted at 54.0 kDa (calculated monomer mass, 50 kDa). Expression. Vectors were prepared for Rpn1, Rpn1PC (residues 438–876), Rpn2 and Rpn2PC (residues 350–730). The full-length coding sequences of RPN1 and RPN2 or base pairs 1314 to 2628 of RPN1 and 1050–2190 of RPN2 were amplified by PCR from genomic DNA (S. cerevisiae wt strain Sub62), using Pfu DNA Polymerase (Promega). The 5′ and 3′ amplification primers were designed to add BamH1 and Sac1 restriction sites to the ends to facilitate subsequent cloning in the pQE30 vector (Qiagen) for expression with a His6 tag. Clones were verified by DNA sequencing and then subcloned into E. coli M15 for expression. Purification. Transformants were grown at 37°C in liquid LB media supplemented with 1 mM ampicillin to A600 values of 0.6–0.8, followed by 30 min heat shock at 42°C. Next, 0.1 mM isopropyl-1-thio-β-D-galactopyranoside was added for induction and cultures were grown overnight at 16°C, then harvested. Cells were lysed and lysates were clarified at 16,000 rpm for 20 min at 4°C, and the supernatant loaded onto a Ni2+-nitrilotriacetic acid column (Qiagen) previously equilibrated with 50 mM Tris, pH 7.4, 500 mM NaCl, and 10 mM Imidazole. Washes were performed with the same buffer and bound proteins were eluted using 50 mM Tris, pH 7.4, 500 mM NaCl, and 250 mM Imidazole. Samples were then concentrated via a 30 ml Centricon (Vivascience), and further purified by gel filtration on a 24 ml Superdex200 column) eluted with 50 mM Hepes, 150mM NaCl, pH 7.4. The resulting proteins were stored at −80°C. Purity was assessed by Coomassie blue staining and immunoblotting. Protein concentrations were determined using an ND-1000 Spectrophotometer (NanoDrop). Gel Filtration. Gel filtration was performed with a Superdex200 column HR 10/30 (Pharmacia), eluted with 50mM HEPES buffer, pH 7.4, containing 150 mM NaCl; the flow rate was 0.3ml/min. The column was calibrated with the following markers: ovalbomin (43 kDa), conalbumin (75 kDa), aldolase (158kDa), and apoferritin (440 kDa).
Fig. 2
Fig. 2
Circular dichroism spectra in the far-UV range (190–260 nm) of recombinant Rpn1, Rpn1PC, Rpn2, and Rpn2PC. Prior to CD analysis, each protein was dialyzed (three times, 100 vol. of sample) against 25mM Borate buffer (pH 7.4). Data were recorded using a Jasco J-810 spectropolarimeter set to the amide band (190–260 nm), a protein concentration of 30 μg/ml, a 0.05 cm cell path length, a scan speed of 30 nm/min, a 0.1nm bandwidth, and a 4ms response. All spectra were measured 5 times, averaged and baseline-corrected by subtraction of blank buffer spectrum. The spectra were analyzed on the DichroWeb website , using the CDSSTR ; and SELCON3 ; algorithms and a reference set containing the spectra of 43 proteins with solved structures .
Fig. 3
Fig. 3
Negative stain electron microscopy. 2D class averages are shown for Rpn2 (row 1), Rpn2PC (row 2), Rpn 1 (row 3) and Rpn1PC (row 4). Microscopy. The purified proteins were brought to final concentrations of 7.5 to 15 μg/mL in 50 mM HEPES and 150 mM NaCl. Grids were prepared by applying 3.5 μl drops to carbon film substrates; after 1 min, blotting away excess sample; then soaking the grid on two successive drops of stain; blotting and allowing to dry. Freshly prepared 1% uranyl formate was used as stain except for Rpn2 (1% uranyl acetate). Micrographs were recorded Kodak SO-163 film, using a Philips CM120 electron microscope operating at 120kV and 45000 to 60,000 magnification. Image analysis. Drift-free micrographs were scanned on a Zeiss scanner at 14 μm step size except for Rpn2 images which were scanned on a Nikon CoolScan 9000 at 6.35 μm. Pixel sizes, after binning the Nikon-scanned data, were between 2.11 and 3.11 Å/pixel. All image preprocessing, including particle boxing and extraction, CTF parameter determination, and correction by phase flipping, was done with the Bsoft package . 1025, 1084, 1951, and 961 particles were picked for Rpn2, Rpn2PC, Rpn1, and Rpn1PC. Computation of reference-free class averages was done as described previously . Initial sets of 2D class averages were generated with the EMAN package with the Refine2D.py script . Class averages were then refined in SPIDER by several rounds of multi-reference alignment, dimension reduction by correspondence analysis, hierarchical ascendant clustering, and averaging until the set of classes obtained was stable from one cycle to the next. The resolution of the class averages varied between 2.1 and 2.9 nm, according to the Fourier ring correlation at 0.5 cutoff.
Fig. 4
Fig. 4
Modeling of Rpn2 PC and comparison of the resulting structures with the EM class averages. (a) Ribbon representations of four models. Model 1: a symmetric 11-repeat toroid; Models 2 and 3: manually distorted 11-repeat toroid; Model 4: predicted PC repeat model based on karyopherin-®2 structure (PDB code: 2h4m) (b) Row 1: 10 EM 2D class averages of Rpn2PC (see Fig. 3). Row 2–5: Each model in (a) was band-limited to (2.5 nm)−1 and used to generate a grid of 2D projections. The projection most similar to each EM class average was identified by cross-correlation, and these projections are shown in rows 2 to 5. Modeling. PDB coordinates for model 1 (Fig. 4) were provided by Dr. A.V. Kajava. Models 2 and 3 were generated manually from this model by distorting it in Chimera . In an alternative approach, amino acid sequences of Rpn1 and Rpn2 were probed for structural homologs , and segments of karyopherin β2 (PDB code: 2h4m 47) were identified as the most likely homolog. Model 4 was obtained by running the sequence alignment from the prediction server into Modeller . For comparison with the EM class averages, the 4 models were band-limited to 2.5 nm resolution and projected on an evenly spaced grid of viewing orientations. To simulate EM image formation, a CTF corresponding to the imaging conditions was applied to the 2D projections. They were then compared to the EM class averages by multi-reference alignment and the projection most similar to each class average was identified by cross correlation.

References

    1. Zwickl P, Baumeister W, Steven A. Dis-assembly lines: the proteasome and related ATPase-assisted proteases. Curr Opin Struct Biol. 2000;10:242–50. - PubMed
    1. Goldberg AL. Protein degradation and protection against misfolded or damaged proteins. Nature. 2003;426:895–9. - PubMed
    1. Glickman MH, Rubin DM, Coux O, Wefes I, Pfeifer G, Cjeka Z, Baumeister W, Fried VA, Finley D. A subcomplex of the proteasome regulatory particle required for ubiquitin-conjugate degradation and related to the COP9-signalosome and eIF3. Cell. 1998;94:615–23. - PubMed
    1. Glickman MH, Rubin DM, Fried VA, Finley D. The regulatory particle of the Saccharomyces cerevisiae proteasome. Mol Cell Biol. 1998;18:3149–62. - PMC - PubMed
    1. Fu H, Reis N, Lee Y, Glickman MH, Vierstra RD. Subunit interaction maps for the regulatory particle of the 26S proteasome and the COP9 signalosome. Embo J. 2001;20:7096–107. - PMC - PubMed

Publication types

MeSH terms

Substances

LinkOut - more resources