. 2009 Mar 20;387(1):175-91.
doi: 10.1016/j.jmb.2009.01.030. Epub 2009 Jan 23.

Pentameric assembly of potassium channel tetramerization domain-containing protein 5

Affiliations

Pentameric assembly of potassium channel tetramerization domain-containing protein 5

Irina S Dementieva et al. J Mol Biol. .

Abstract

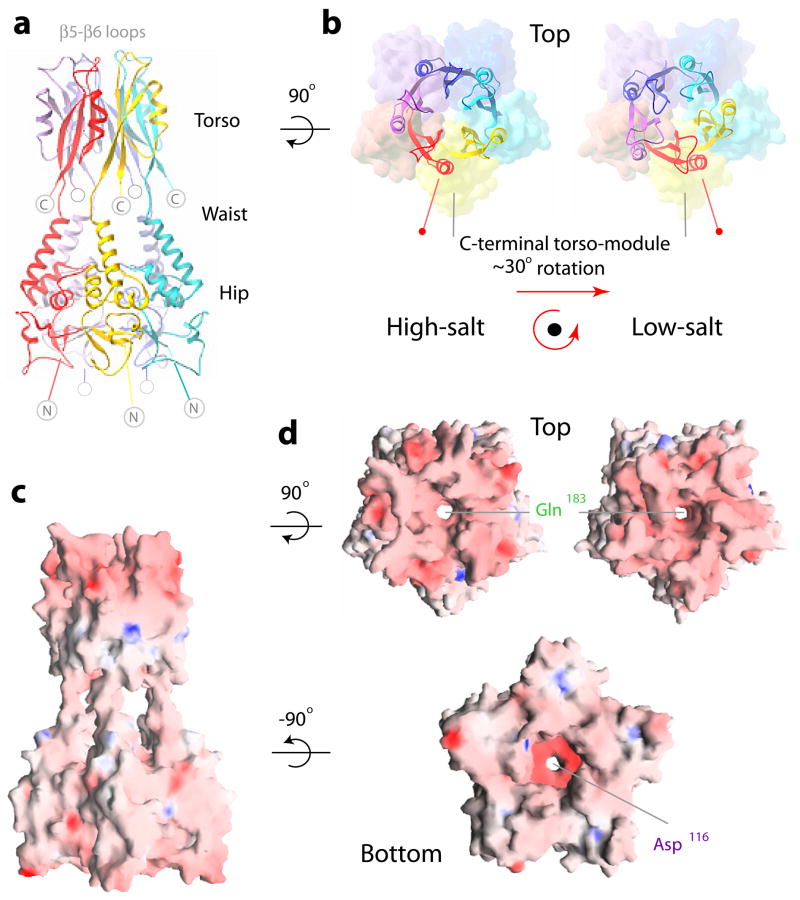
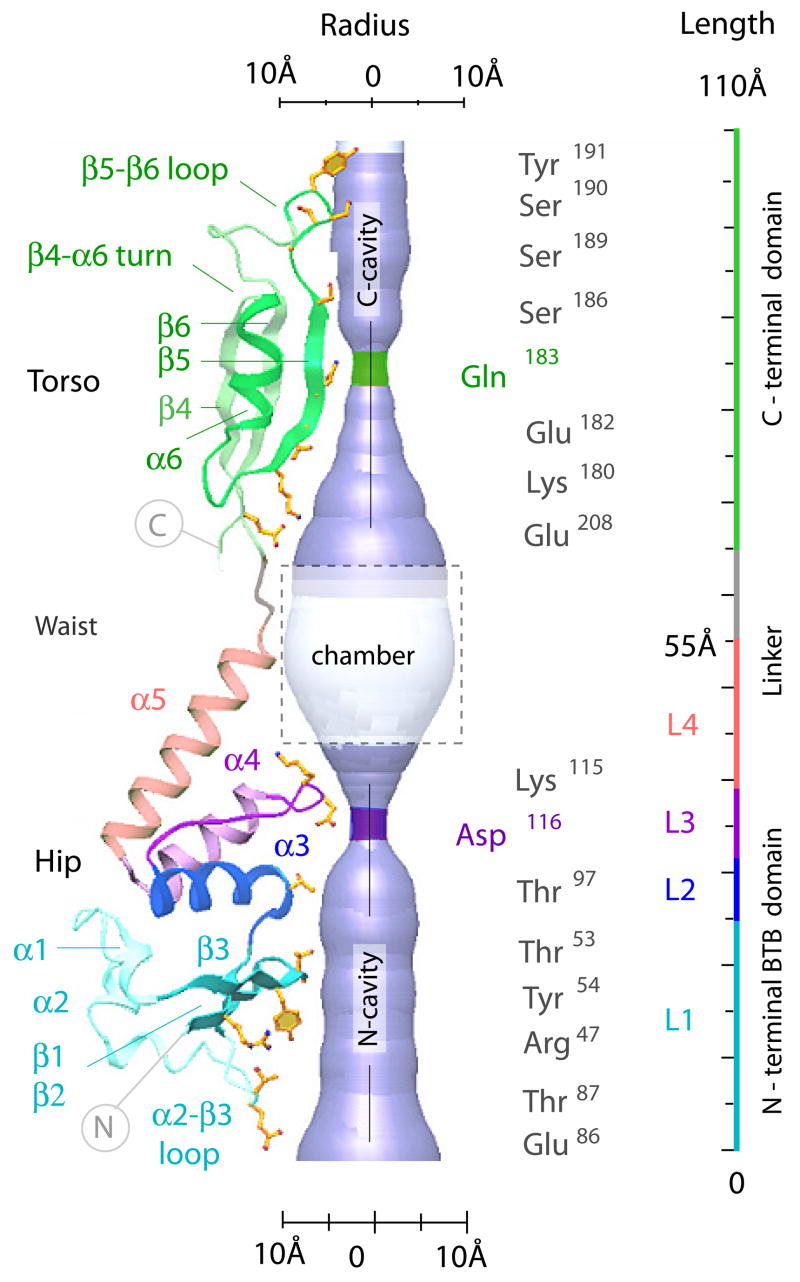
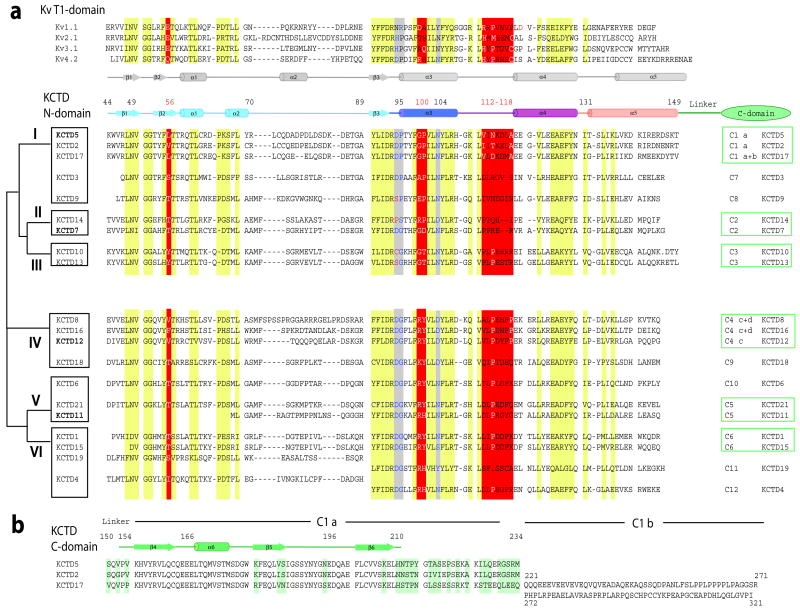
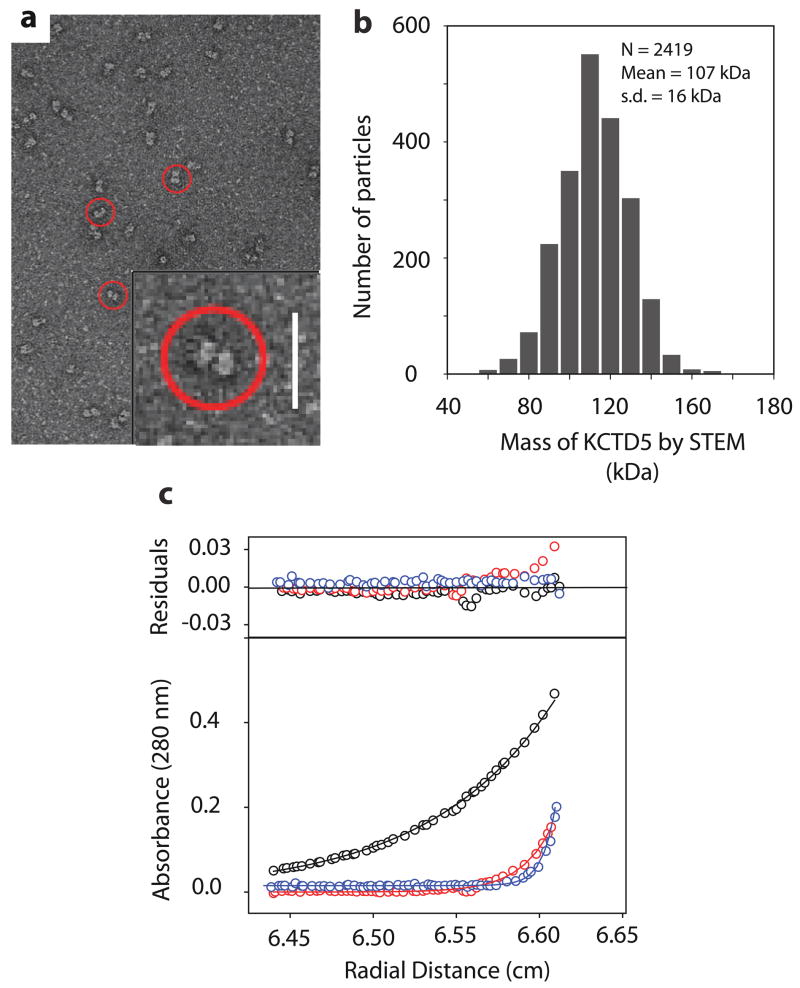
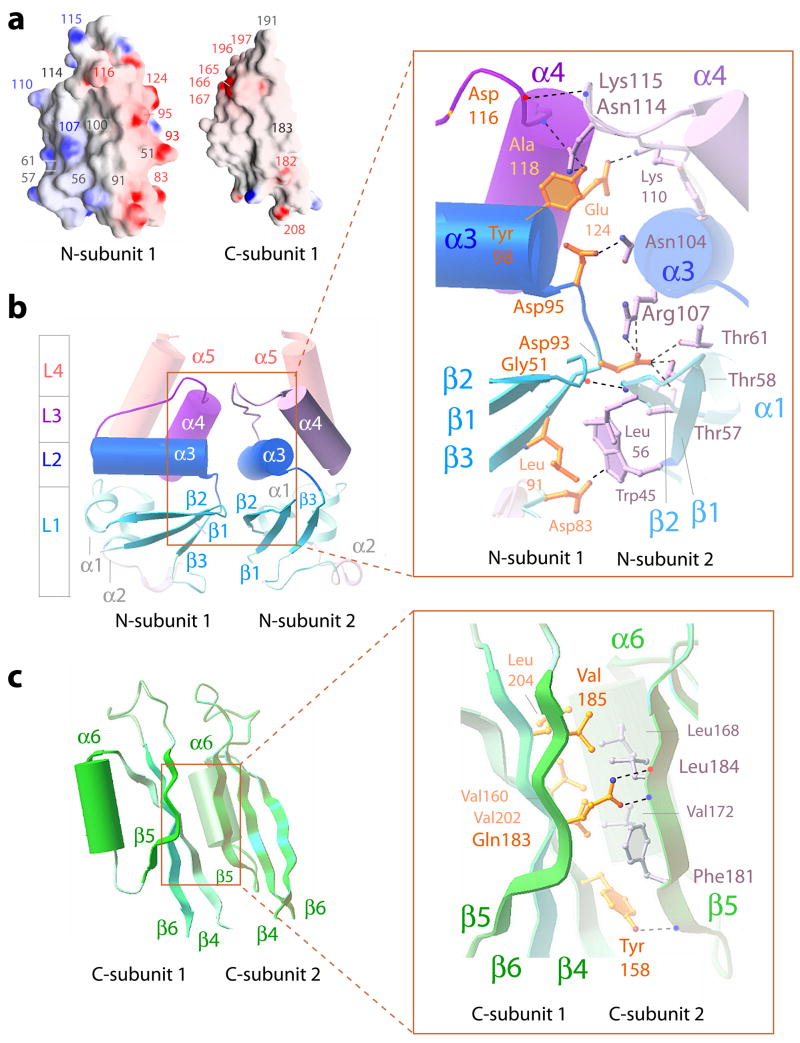
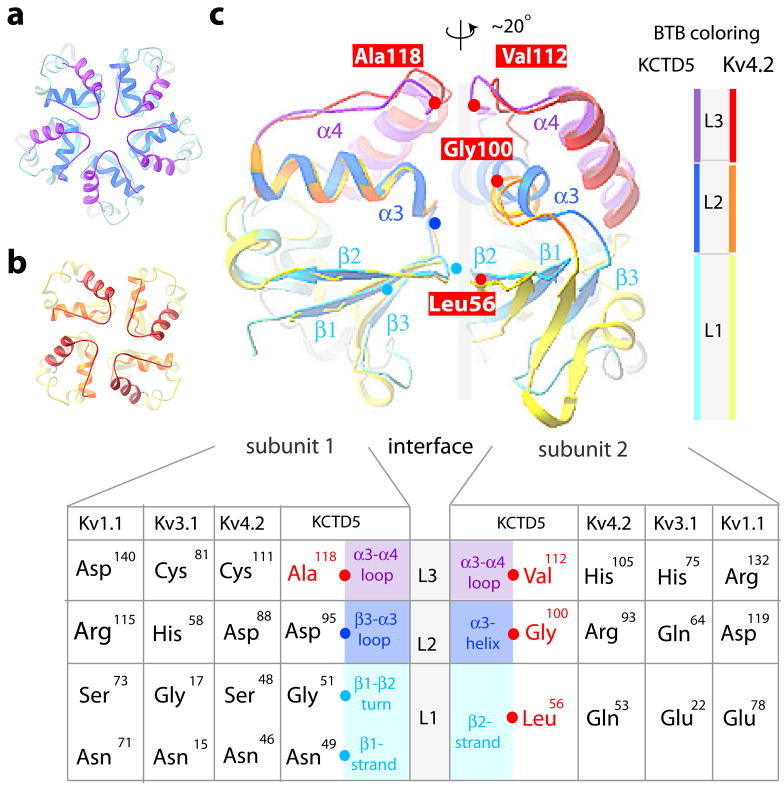
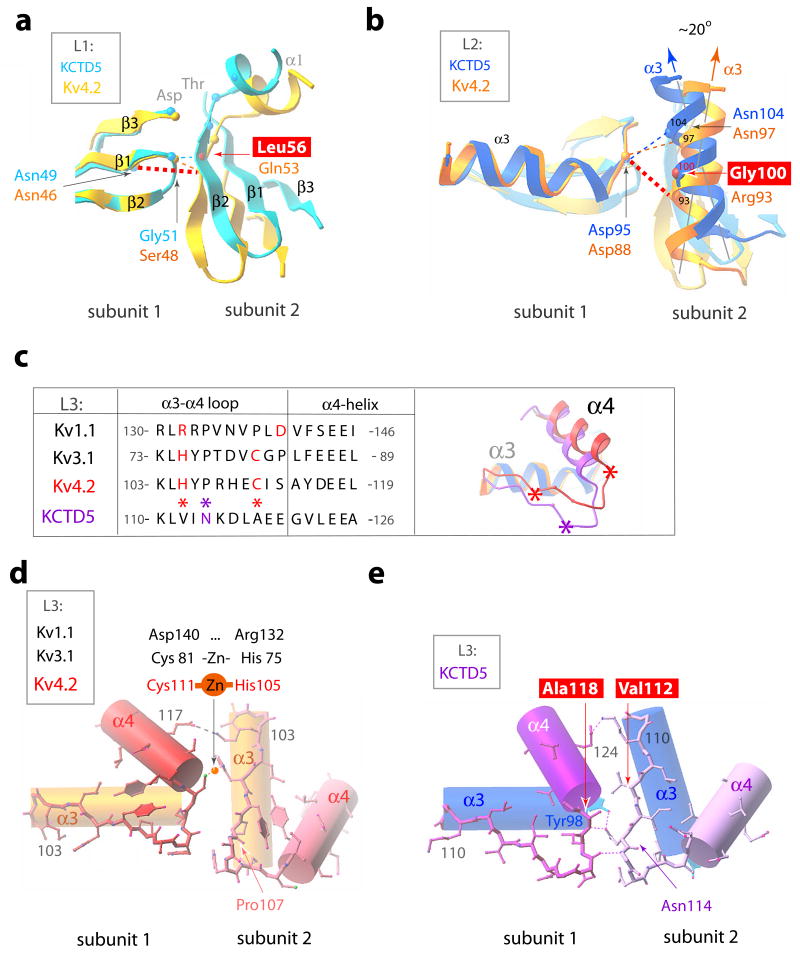
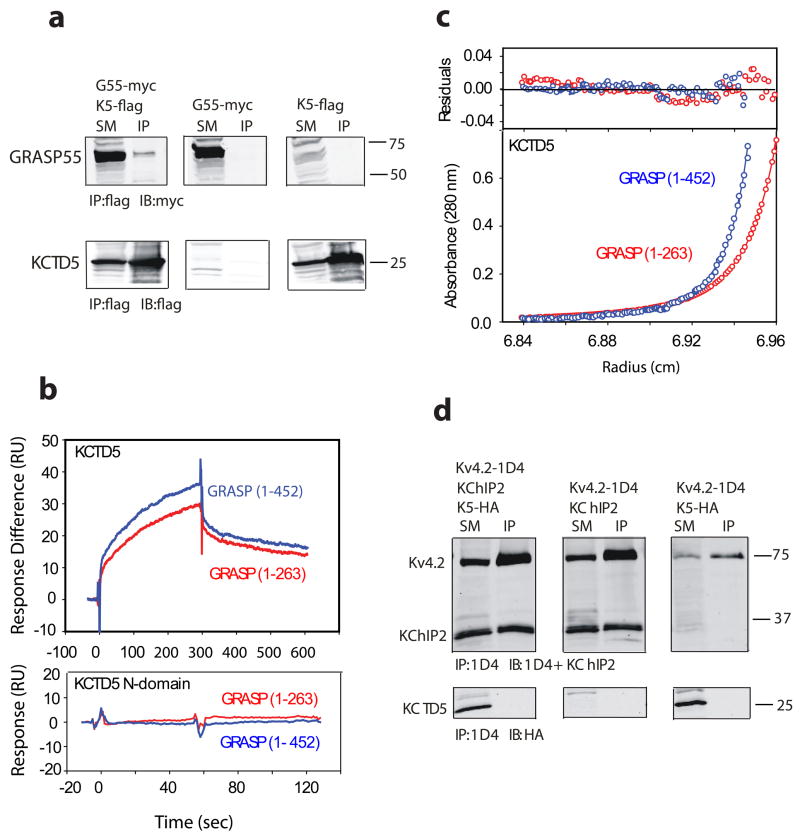
We report the X-ray crystal structure of human potassium channel tetramerization domain-containing protein 5 (KCTD5), the first member of the family to be so characterized. Four findings were unexpected. First, the structure reveals assemblies of five subunits while tetramers were anticipated; pentameric stoichiometry is observed also in solution by scanning transmission electron microscopy mass analysis and analytical ultracentrifugation. Second, the same BTB (bric-a-brac, tramtrack, broad complex) domain surface mediates the assembly of five KCTD5 and four voltage-gated K(+) (Kv) channel subunits; four amino acid differences appear crucial. Third, KCTD5 complexes have well-defined N- and C-terminal modules separated by a flexible linker that swivels by approximately 30 degrees; the C-module shows a new fold and is required to bind Golgi reassembly stacking protein 55 with approximately 1 microM affinity, as judged by surface plasmon resonance and ultracentrifugation. Fourth, despite the homology reflected in its name, KCTD5 does not impact the operation of Kv4.2, Kv3.4, Kv2.1, or Kv1.2 channels.


Figures

Figure 1
Figure 1. Architecture of KCTD5 by X-ray crystallography
a. Side-view ribbon representation of KCTD5 complexes (residues 44–211, high-salt crystal form); the five subunits are in red, yellow, cyan, blue and violet. The N-module (hip), inter-domain linker (waist), C-module (torso), and β5-β6 loops are labeled. N-terminal amino acids 1–33 and C-terminal residues 212–234 are not in the crystal structure and indicated by gray circles. b. Orientation of the C-module (residues 155–211, ribbons) relative to the N-module (residues 44–149, molecular surface). Top views for two different crystal forms, high-salt (left) and low-salt (right). Color scheme as in a. To highlight the change in orientation, N-modules in high- and low-salt crystals are aligned and α6 marked. The β5-β6 loops are modeled as in the well-defined electron density maps of the blue (high-salt) or cyan (low-salt) subunits; more detail on these loops is in Fig. S1. c. Electrostatic surface representation side view high-salt crystal form. Blue is electropositive and red is electronegative. d. Electrostatic surface representation for top views (upper) for high-salt (left) and low-salt (right) crystal forms aligned via their N-modules; bottom view (lower) high-salt crystal form. Color scheme as in c.
Figure 2
Figure 2. Structural determinants of the KCTD5 central cavity
A KCTD5 subunit in ribbon presentation showing the four segments (L1–L4) of the BTB fold and the central cavity of the pentamer assembly in cut-away. The residues that shape the central cavity are labeled in ball-and-stick mode and also shown are the solvent accessible surfaces and cavity dimensions.
Figure 3
Figure 3. Sequence and secondary structure alignments
KCTD BTB domains share 33% to 43% sequence homology with T1 domains of Kv channels , with most differences in the middle and C-terminus of the fold. Zinc binding motifs in T1 domains of Kv2, Kv3 and Kv4 channels are not found in KCTDs. a. Alignment of T1-domains of select Kv channels and KCTD N-terminal BTB domains based on X-ray structures: KCTD5 (this work), Kv1.1 (PDBid 1T1D), Kv3.1 (PDBid 3KVT), Kv4.2 (PDBid 1NN7). Secondary structure elements are those determined for Kv4.2 and KCTD5. Conserved patches are highlighted in yellow. Key differences are highlighted in red. The alignment of KCTD proteins was by ClustalW. KCTD20 is omitted. The schematic on left is a KCTD group classification. Residues before the BTB domain are omitted. The KCTD5 N-terminal BTB fold is 106 residues long (residues 44–149). The consensus sequence (including insertions) is 110 amino acids with 26 residues in the diverse α2-β3 loop (corresponds to KCTD5 residues 70–89) and 14 residues in α5 (KCTD5 residues 132–149). Sequences of the α2-β3 loop and α5-helix display homology only between proteins of the same group. The C-termini of 14 KCTDs show significant identity with at least one other variant while seven are distinct. The % similarity of groups C1, C2, C3, C4, C5, and C6 are 88, 50, 93, 69, 48, and 83, respectively. b. Alignment of KCTD5, KCTD2 and KCTD17 C-termini; differences are highlighted in green. Residues 212–234 are disordered in the KCTD5 crystal structure.
Figure 4
Figure 4. Electron microscopic and analytical ultracentrifugation studies
a. Electron micrograph of KCTD5 negatively stained with 2% (w/v) uranyl acetate shows particles with a two domain architecture (circled) at 72,000X. Inset scale bar, 20 nm. b. Histogram of quantitative STEM mass analysis of KCTD5 (34–234) particles reveals a mass distribution with a mean of 107 kDa. Scatter from individual particles (N = 2419) and conversion to absolute mass as per Methods. s.d. = standard deviation. c. Sedimentation equilibrium data for KCTD5 (34–234) fit using SEDPHAT. KCTD5 absorbance (280 nm) is shown at 12,000 rpm (black), 24,000 rpm (red) and 36,000 rpm (blue) for analyses with 0.35 mg/ml. The upper panel shows residual difference between the calculated fit and experimental data.
Figure 5
Figure 5. Intermolecular interfaces in KCTD5 assemblies
a. Potential surfaces of individual KCTD subunit N- and C-modules. Indicated in red are acidic Asp83, Asp93, Asp95, Asp116, Glu124, Glu165–167, Glu196, Asp197, Glu182, and Glu208; basic residues Arg107, Lys110 and Lys115 are indicated in blue. Gly51, Leu56, Thr57, Thr61, Leu91, Gly100, Asn114 and Gln183 are noted in gray. b. Secondary structural elements at the interface of adjacent subunits in the N-module viewed from the center of the assembly. α-helices and β-strands are depicted as cylinders and arrows, respectively. The L1–L4 segments of the BTB fold are shown in colors per Fig. 2. Inset is expanded view of boxed area. Residues that form interfaces are shown in ball-and-stick in yellow (subunit 1) and gray (subunit 2). H-bonds (2.6–3.4 Å) are indicated with dotted lines. Asp116 (subunit 1) and Lys115 (subunit 2) interact via main chain atoms and their side chains are omitted for clarity. H-bond pairs and distances are noted in further detail in Fig. S2a c. Secondary structural elements at the interface of adjacent subunits in the C-module viewed from the center of the assembly as in b. Inset is expanded view of boxed area as in b. H-bond pairs and distances are noted in further detail in Fig. S2b
Figure 6
Figure 6. BTB protein-protein interfaces in KCTD5 and T1 domain assemblies
BTB layers are: L1 in cyan (KCTD5) and yellow (Kv4.2); L2 in blue (KCTD5) and gold (Kv4.2); L3 in violet (KCTD5) and red (Kv4.2). L4 α5 helix is omitted for clarity. X-ray structures used: KCTD5 (high-salt), Kv1.1 (PDBid 1T1D), Kv3.1 (PDBid 3KVT), and Kv4.2 (PDBid 1NN7). a. Top view of a pentameric assembly of KCTD5 N-modules. b. Top view of a tetrameric assembly of Kv4.2 T1 domains. c. Comparison of pairs of adjacent subunits for the KCTD5 N-module and the Kv4.2 T1 domain. To highlight the ~20° difference in orientation, subunit pairs were aligned on subunit 1 (left). Cα atoms of four key aliphatic residues in KCTD5 are noted (red spheres) and labeled; Cα atoms of their partners are in cyan (L1) or blue (L2). Inset. Correspondence of KCTD5 and T1 residues by layer with KCTD5 secondary structure elements noted. Interface H-bond pairs and distances are in Fig. S2c.
Figure 7
Figure 7. BTB intra-molecular interactions in KCTD5 and T1 domains
KCTD5 (high-salt) and Kv4.2 (PDBid 1NN7) structures are shown in the color scheme of Fig. 6. H-bonds indicated as dashed lines. Four key residue differences between the KCTD5 and T1 interfaces are boxed. a. BTB L1. Interacting residues shown as small spheres at the Cα-atoms. The view is perpendicular to the image in Fig. 6c. b. BTB L2. Presentation as in panel a. The ~20° difference in orientation of α3-helix axes of KCTD5 and Kv4.2 is indicated. c. BTB L3 sequence alignment and ribbon presentation for KCTD5 and Kv4.2 viewed from top. Val112, Ala118 and Asn114 in KCTD5 are marked with asterisks. d. BTB L3 in Kv4.2 α3- and α4 helices are shown as cylinders and the α3-α4 loop in ball-and-stick mode. Arg108 side chain omitted for clarity. e. BTB L3 in KCTD5. Representation as in d. Lys115 side chain omitted for clarity.
Figure 8
Figure 8. Binding of KCTD5 and GRASP55 in solution
a. KCTD5 (K5) co-purifies with GRASP55 (G55) when co-expressed in HEK293 cells. Starting material (SM) was detergent-soluble lysate that was incubated with antibody to flag to yield immunoprecipitate (IP); SM and IP were resolved by SDS-PAGE and visualized by Western blot (IB) with antibody to myc or flag. Upper panels show that GRASP55 is isolated specifically with KCTD5 and not seen either in the absence of KCTD5 or GRASP55. Lower panels show KCTD5 is isolated in complexes with GRASP55. Numbers indicate apparent mass in kDa. b. KCTD5 and GRASP55 studied by SPR. Upper panel depicts binding of full length GRASP55 (blue line) or truncated GRASP55 (1–263, red line) to KCTD5 (residues 34–234) immobilized on the surface. GRASP proteins injected at 5 μM. Measured biophysical parameters listed in Table 2. Lower panel shows that GRASP55 does not bind to the KCTD5 N-terminal domain. c. Equilibrium sedimentation shows association of KCTD5 and GRASP55. Here, KCTD5 residues 34–234 (9.2 μM) and full length GRASP55 (blue line, 2.6 μM) or truncated GRASP55 (1–263, red line, 2.5 μM) are shown at 24,000 rpm in the lower panel. The upper panel shows residual difference between the calculated fit and experimental data. Nine data sets (three speeds, six concentrations) were analyzed globally using SEDPHAT 4.3 software (Methods) yields an equilibrium binding affinity of 1.41 ± 0.26 μM and 8.26 ± 1.6 μM for full-length and truncated GRASP55, respectively. Estimated partial specific volumes and solvent densities of KCTD5 with full length and truncated GRASP55 were 0.733 cm3 g−1 and 0.99823 g ml−1, respectively. d. Kv4.2 and KChIP2 form complexes but not KCTD5 on co-expression in COS cells. Lysates were incubated with antibody to 1D4, resolved by SDS-PAGE and the interaction visualized by Western blot analysis with antibodies to KChIP2 and HA. Upper panels show that KChIP2 is purified with Kv4.2. Lower panels show that KCTD5 does not co-immunoprecipitate with Kv4.2 in the presence or absence of KChIP2 despite synthesis of the protein. Numbers indicate apparent mass in kDa.

Similar articles

Cited by

References

    1. Shen NV, Chen X, Boyer MM, Pfaffinger PJ. Deletion analysis of K+ channel assembly. Neuron. 1993;11:67–76. - PubMed
    1. Lee TE, Philipson LH, Kuznetsov A, Nelson DJ. Structural determinant for assembly of mammalian K+ channels. Biophys J. 1994;66:667–673. - PMC - PubMed
    1. Bardwell VJ, Treisman R. The POZ domain: a conserved protein-protein interaction motif. Genes Dev. 1994;8:1664–1677. - PubMed
    1. Zollman S, Godt D, Prive GG, Couderc J, Laski FA. The BTB Domain, Found Primarily in Zinc Finger Proteins, Defines an Evolutionarily Conserved Family that Includes Several Developmentally Regulated Genes in Drosophila. Proc Natl Acad Sci. 1994;91:10717–10721. - PMC - PubMed
    1. Marchler-Bauer A, Anderson JB, Derbyshire MK, DeWeese-Scott C, Gonzales NR, Gwadz M, et al. CDD: a conserved domain database for interactive domain family analysis. Nucl Acids Res. 2007;35:D237–240. - PMC - PubMed

Publication types