. 2009 Apr;84(4):445-58.
doi: 10.1016/j.ajhg.2009.03.011.

Genetic control of human brain transcript expression in Alzheimer disease

Affiliations

Genetic control of human brain transcript expression in Alzheimer disease

Jennifer A Webster et al. Am J Hum Genet. 2009 Apr.

Abstract

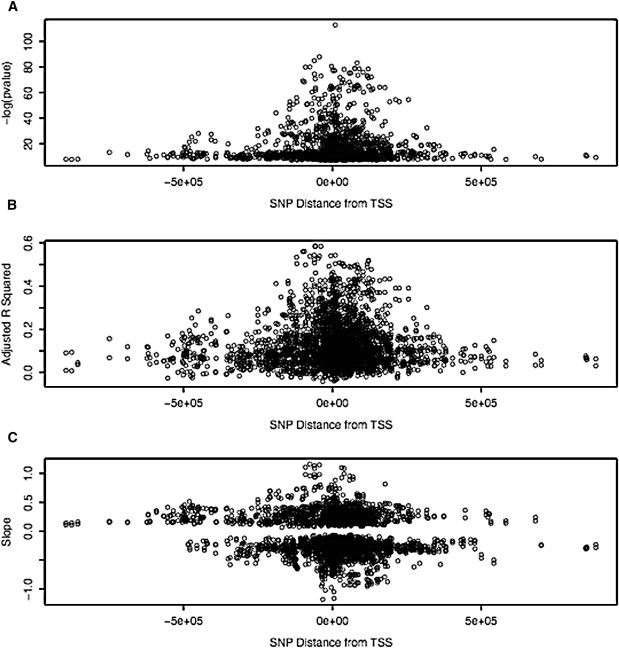
We recently surveyed the relationship between the human brain transcriptome and genome in a series of neuropathologically normal postmortem samples. We have now analyzed additional samples with a confirmed pathologic diagnosis of late-onset Alzheimer disease (LOAD; final n = 188 controls, 176 cases). Nine percent of the cortical transcripts that we analyzed had expression profiles correlated with their genotypes in the combined cohort, and approximately 5% of transcripts had SNP-transcript relationships that could distinguish LOAD samples. Two of these transcripts have been previously implicated in LOAD candidate-gene SNP-expression screens. This study shows how the relationship between common inherited genetic variants and brain transcript expression can be used in the study of human brain disorders. We suggest that studying the transcriptome as a quantitative endo-phenotype has greater power for discovering risk SNPs influencing expression than the use of discrete diagnostic categories such as presence or absence of disease.


Figures

Figure 1
Figure 1
Cis Association Metrics Versus Distance from Transcription Start Site Plotted on the x axis is the distance from the TSS mapped on the human genome build 36. y axis metrics are given, with slope in Figure 1C corresponding to the β values from the correlations. Note that −log(p value) values were calculated in the 2 df model with the use of the entire series, whereas the β values and the adjusted correlation coefficients were calculated separately in cases and controls, but all values are plotted.
Figure 2
Figure 2
Adjacency Matrix of the eQTL and DE Network Figure 2A shows the adjacency matrix for our HQCUT network analysis. Modules in this figure are labeled c1–c9. Genes are listed by map number (1–1697) that was assigned during the clustering procedure and is arbitrary. Dots represent inter- and intramodule relationships between transcripts. Figure 2B shows the number of transcripts per cluster.
Figure 3
Figure 3
Cluster 2 C6orf29 Network Diagrammed in the figure are the predicted transcript relationships given from our analysis using NEO to impart directionality on the transcript-transcript correlations that we predicted from HQCUT for the transcripts in cluster 2. For clarity, only transcripts that had correlations with SNP genotype and an interaction with C6orf29 are listed (25% of cluster 2). In the figure, SNP-transcript relationships are given by dashed arrows and transcript-transcript relationships by solid arrows. Transcripts are indicated by circles, gray circles indicating transcripts where there was a significant interaction with diagnosis in the eQTL analysis and white circles indicating no significant interaction term. Bidirectional arrows indicate a feedback loop between the two transcripts analyzed as predicted by NEO analysis. Bidirectional arrows divided by black circles indicate that NEO predicted an unmapped hidden confounder in the analysis of the relationship between the two transcripts.
Figure 4
Figure 4
SNP-Transcripts Specific to Disease Are More Likely to Be Discovered in a Cohort with Disease-Specific Samples The proportion of effects that we could detect from our current study, utilizing brains from LOAD cases and nondemented controls, in a sample of equal size (n = 364) generated by bootstrapping our control data is plotted. The alpha cutoff is plotted on the x axis and the proportion of effects detected is on the y axis. The proportion of eQTLs detected of those that showed a significant diagnosis interaction (α = 0.05 for the interaction term in our 2 df model) is shown by the filled circles and solid line. The proportion detected of those that did not have a significant diagnosis effect (interaction term p value ≥ 0.05) is shown by the open circles and dotted line. Counts and alphas used to generate this graph are given in Table S4.

References

    1. Schadt E.E. Exploiting naturally occurring DNA variation and molecular profiling data to dissect disease and drug response traits. Curr. Opin. Biotechnol. 2005;16:647–654. - PubMed
    1. Dixon A.L., Liang L., Moffatt M.F., Chen W., Heath S., Wong K.C., Taylor J., Burnett E., Gut I., Farrall M. A genome-wide association study of global gene expression. Nat. Genet. 2007;39:1202–1207. - PubMed
    1. Göring H.H., Curran J.E., Johnson M.P., Dyer T.D., Charlesworth J., Cole S.A., Jowett J.B., Abraham L.J., Rainwater D.L., Comuzzie A.G. Discovery of expression QTLs using large-scale transcriptional profiling in human lymphocytes. Nat. Genet. 2007;39:1208–1216. - PubMed
    1. Moffatt M.F., Kabesch M., Liang L., Dixon A.L., Strachan D., Heath S., Depner M., von Berg A., Bufe A., Rietschel E. Genetic variants regulating ORMDL3 expression contribute to the risk of childhood asthma. Nature. 2007;448:470–473. - PubMed
    1. Emilsson V., Thorleifsson G., Zhang B., Leonardson A.S., Zink F., Zhu J., Carlson S., Helgason A., Walters G.B., Gunnarsdottir S. Genetics of gene expression and its effect on disease. Nature. 2008;452:423–428. - PubMed

Publication types