. 2009 Apr 17;30(4):533-43.
doi: 10.1016/j.immuni.2009.02.008. Epub 2009 Apr 9.

Lyn kinase controls basophil GATA-3 transcription factor expression and induction of Th2 cell differentiation

Affiliations

Lyn kinase controls basophil GATA-3 transcription factor expression and induction of Th2 cell differentiation

Nicolas Charles et al. Immunity. .

Abstract

T helper 1 (Th1)-Th2 cell balance is key to host defense and its dysregulation has pathophysiological consequences. Basophils are important in Th2 cell differentiation. However, the factors controlling the onset and extent of basophil-mediated Th2 cell differentiation are unknown. Here, we demonstrate that Lyn kinase dampened basophil expression of the transcription factor GATA-3 and the initiation and extent of Th2 cell differentiation. Lyn-deficient mice had a marked basophilia, a constitutive Th2 cell skewing that was exacerbated upon in vivo challenge of basophils, produced antibodies to a normally inert antigen, and failed to appropriately respond to a Th1 cell-inducing pathogen. The Th2 cell skewing was dependent on basophils, immunoglobulin E, and interleukin-4, but was independent of mast cells. Our findings demonstrate that basophil-expressed Lyn kinase exerts regulatory control on Th2 cell differentiation and function.


Figures

Figure 1
Figure 1. lyn−/− mice develop peripheral basophilia
(A–C, E) Flow cytometric analysis of basophil content (defined as FcεRI+ c-Kit CD11b+ CD49b+ cells) in blood (leukocytes), peritoneal lavage (PL) and bone marrow (BM). (A) Basophil content in the blood of WT (n=44), lyn+/− (n=14) and lyn−/− (n=31) mice. (B) Basophil content in PL of WT (n=39), lyn+/−: (n=14), and lyn−/− (n=24) mice. (C) Basophil content in BM of WT (n=41), lyn+/− (n=10), and lyn−/− (n=28) mice. (D) Absolute number of basophils per ml of blood in WT (n=13) and lyn−/− (n=13) mice was determined by direct cell counting. (E) Blood basophil content in WT and lyn−/− mice from different genetic backgrounds (B6.129: mixed background 129Sv to C57BL/6, N6) B6.129 WT: n=44, B6.129 lyn−/−: n=31; C57BL/6 WT: n=10, C57BL/6 lyn−/−: n=8; 129Sv WT: n=10, 129Sv lyn−/−: n=11. (A–E), Data are reported as a mean ± sem, ns.: not significant, *: p<0.05, **: p<0.01, ***: p<0.001..
Figure 2
Figure 2. Lyn-deficiency enhances basophil proliferation
(A) Flow cytometric analysis of lyn−/− bone marrow (BM) cells in culture. Mast cells were identified as FcεRl+ c-Kit+ cells, and basophils as FcεRl+ c-Kit CD11b+ CD49b+ cells. One representative of 12 experiments. (B) Proliferation of bone-marrow derived cultured basophils from WT or lyn−/− mice (at day 9 of culture) determined by CFSE staining over 96 hours as analyzed by flow cytometry. One representative of 3 experiments. (C, D) Flow cytometry analysis of basophil appearance in BM (C, n=5) or PL (D, n=12) cells cultures from WT (closed circles) and lyn−/− (opened diamond) mice. Statistical analysis was by one way ANOVA and a paired two-tailed student t test for each time point (mean ± sem), *: p<0.05, **: p<0.01.
Figure 3
Figure 3. The production of IL-4 is enhanced in lyn−/− bone marrow-derived cultured basophils and in blood basophils from lyn−/− mice
(A, B) Cultured BM cells were sensitized with IgE anti-DNP at day 7 of culture. The following day, cells were stimulated (black line) or not (grey line) for 4hr with 50 ng/ml of DNP-HSA in presence of 10 µM monensin. Cells were labeled for the indicated surface markers, then fixed, permeabilized and intracellular cytokines were detected with fluorescent anti-mouse-IL-4. (B) Fold induction is the ratio of the median fluorescence intensity of the studied cytokine in stimulated cells vs. unstimulated cells (n=16). (C) Ex vivo basophil stimulation with anti-IgE or isotype control IgG for 4 hrs using blood samples from IgE-sensitized WT or lyn−/− mice (n=10 for each indicated group, as described in Figure S4). Plasma was then collected and the concentration of IL-4 was determined by ELISA. (D) Aliquots of the blood from the same mice used in (C) were used to determine absolute number of basophils/ml. Data is expressed as the amount of IL-4 (pg) per 103 basophils. Statistical analysis was by an unpaired two-tailed student t test (mean ± sem), *: p<0.05.
Figure 4
Figure 4. Lyn deficiency causes an early and inappropriate onset of IL-4 dependent TH2 responses
Papain-specific IgE production in the serum of WT and lyn−/− mice (A) and of WT and double deficient IL-4−/− -lyn−/− mice (E) in response to (papain) immunization. Experiment shown in (A) is representative of 4 independent experiments (compiled data in Figure S5B); (A, E) n=3 (mice), for each indicated group per experiment. (B) TSLP levels measured in the serum of WT and lyn−/− mice from experiment shown in (A) (n=3 per group). (C) HSA-specific IgE production in the serum of WT and lyn−/− mice in response to HSA immunization. Arbitrary Units correspond to the absorbance at 450nm normalized to the background values of the ELISA. Experiment shown is representative of 4 independent experiments using an n=3 mice in the indicated groups per experiment. (D) Peripheral basophilia in IL-4−/− -lyn −/− double deficient mice (n=48) compared to WT mice (n=48) as determined by flow cytometry of blood samples. Statistical analysis was by an unpaired two-tailed student t test (mean ± sem), ***: p<0.001.
Figure 5
Figure 5. TH2 skewing of CD4+ T cells is driven by in vivo activation of basophils, is exacerbated by Lyn-deficiency, depends on IgE and basophils, but not on mast cells
(A, B) Splenocytes from WT and lyn−/− mice were harvested and re-stimulated (or not) for 4 hours with PMA/ionomycin. Splenocytes were labeled with a fluorescent anti-CD4 antibody, fixed and permeabilized, and then stained for intracellular IL-4 and IFN-γ. (A) Representative flow cytometric analysis of CD4+ cells from WT or lyn−/− mice showing IL-4 producing T cells in the absence of stimulation (−) and no IFN-γ producing cells. Non-specific restimulation (+) with PMA/ionomycin enhanced IL-4 production and initiated IFN-γ production. (B) Compilation of all individual experiments as in (A) for CD4+IL-4+ T cells. (C) Similar experiment as in (A, B) but analyzing WT and IgE−/− lyn−/− mice for CD4+IL-4+ T cells. (D) As in (B, C) but comparing basophil depleted (Baso(−)) or not (Baso(+)) WT and lyn−/− mice for CD4+IL-4+ T cells. (E, F) WSh /WSh or WSh/WSh -lyn−/− mice were injected with rat anti-mouse IgE to stimulate basophils in vivo (20 hrs) prior to ex vivo restimulation (+) or not (−). The same conditions as in (A, B) were used. (E) Representative flow cytometric analysis showing CD4+IL-4+ producing cells after in vivo stimulation of basophils (−). Restimulation (+) with PMA/ionomycin showed CD4+ IFN-γ+ T cells. ( F) Compilation of all results for CD4+ IL-4+ T cells observed in experiments like (E). (B, C, D, F) Statistical analysis was by an unpaired two-tailed student t test (mean), *: p<0.05, **: p<0.01, ***: p<0.001.
Figure 6
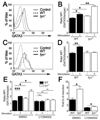
Figure 6. GATA-3 expression is increased in lyn−/− basophils, decreased in fyn−/− basophils and depends on PI3K activity
(A) GATA-3 levels were determined by intracellular staining of spleen basophils from WT and lyn−/− and analyzed by flow cytometry. Data presented are representative of 3 individual experiments. (B) IgE sensitized BM-derived cultured (8 days) basophils from WT and lyn−/− mice were stimulated or not with 50 ng/ml DNP-HSA for 2 hours. GATA3 levels were determined as in (A). Data are expressed as a ratio of mean fluorescence intensity (MFI) for GATA3 staining versus isotype control staining for each tested condition. Per group, n=3. (C, D) Same experiments and conditions as described in (A,B) using WT and fyn−/− mice. (E) Same experiments and conditions as described in (B), however, cells were pre-incubated for 30 min with 30 µM LY294002 (PI3K inhibitor) or the same volume of vehicle (DMSO). GATA3 levels were determined as in (A). Per group, n=3. (F) Same cells as in (E) but cells were incubated an additional 2 hours in the presence of 10 µM monensin. IL-4 production by basophils was determined by flow cytometry as described in Figure 3B. (B,D,F) Statistical analysis was by an unpaired two-tailed student t test (mean ± sem), *: p<0.05, **: p<0.01.
Figure 7
Figure 7. lyn−/− mice show impaired production of IFN-γ and fail to mount an appropriate host response to Toxoplasma gondii infection
Mice (WT or lyn−/−) were infected with 20 cysts of the avirulent T. gondii strain ME49 and analyzed for host responses during acute and chronic stages of infection. (A) At day 7, serum IFN-γ was measured by ELISA. (B) Host responses of chronically infected mice were assessed at week 4 by quantifying the numbers of encysted bradyzoites in the brain. (A, B) Statistical analysis was by an unpaired two-tailed student t test (mean ± sem), *: p<0.05, **: p<0.01,

Similar articles

Cited by

References

    1. Beavitt SJ, Harder KW, Kemp JM, Jones J, Quilici C, Casagranda F, Lam E, Turner D, Brennan S, Sly PD. Lyn-deficient mice develop severe, persistent asthma: Lyn is a critical negative regulator of Th2 immunity. J. Immunol. 2005;175:1867–1875. - PubMed
    1. Cannons JL, Yu LJ, Hill B, Mijares LA, Dombroski D, Nichols KE, Antonellis A, Koretzky GA, Gardner K, Schwartzberg PL. SAP regulates T(H)2 differentiation and PKC-theta-mediated activation of NF-κB1. Immunity. 2004;21:693–706. - PubMed
    1. Capron A, Dombrowicz D, Capron M. Helminth infections and allergic diseases: from the Th2 paradigm to regulatory networks. Clin. Rev. Allergy Immunol. 2004;26:25–34. - PubMed
    1. Dardalhon V, Korn T, Kuchroo VK, Anderson AC. Role of Th1 and Th17 cells in organ-specific autoimmunity. J. Autoimmun. 2008;31:252–256. - PMC - PubMed
    1. Davidson D, Shi X, Zhang S, Wang H, Nemer M, Ono N, Ohno S, Yanagi Y, Veillette A. Genetic evidence linking SAP, the X-linked lymphoproliferative gene product, to Src-related kinase FynT in T(H)2 cytokine regulation. Immunity. 2004;21:707–717. - PubMed

Publication types

MeSH terms