. 2009 May 29;389(1):183-98.
doi: 10.1016/j.jmb.2009.04.007. Epub 2009 Apr 9.

Molecular Interactions between HIV-1 integrase and the two viral DNA ends within the synaptic complex that mediates concerted integration

Affiliations

Molecular Interactions between HIV-1 integrase and the two viral DNA ends within the synaptic complex that mediates concerted integration

Sibes Bera et al. J Mol Biol. .

Abstract

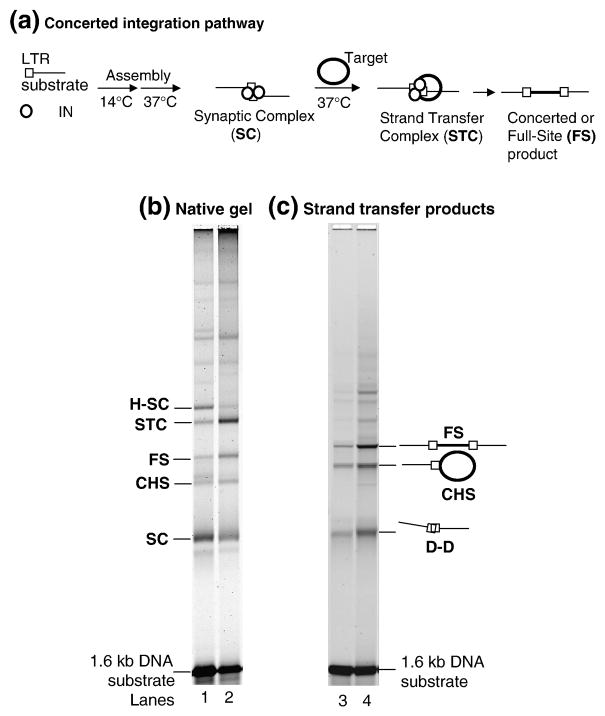
A macromolecular nucleoprotein complex in retrovirus-infected cells, termed the preintegration complex, is responsible for the concerted integration of linear viral DNA genome into host chromosomes. Isolation of sufficient quantities of the cytoplasmic preintegration complexes for biochemical and biophysical analysis is difficult. We investigated the architecture of HIV-1 nucleoprotein complexes involved in the concerted integration pathway in vitro. HIV-1 integrase (IN) non-covalently juxtaposes two viral DNA termini forming the synaptic complex, a transient intermediate in the integration pathway, and shares properties associated with the preintegration complex. IN slowly processes two nucleotides from the 3' OH ends and performs the concerted insertion of two viral DNA ends into target DNA. IN remains associated with the concerted integration product, termed the strand transfer complex. The synaptic complex and strand transfer complex can be isolated by native agarose gel electrophoresis. In-gel fluorescence resonance energy transfer measurements demonstrated that the energy transfer efficiencies between the juxtaposed Cy3 and Cy5 5'-end labeled viral DNA ends in the synaptic complex (0.68+/-0.09) was significantly different from that observed in the strand transfer complex (0.07+/-0.02). The calculated distances were 46+/-3 A and 83+/-5 A, respectively. DNaseI footprint analysis of the complexes revealed that IN protects U5 and U3 DNA sequences up to approximately 32 bp from the end, suggesting two IN dimers were bound per terminus. Enhanced DNaseI cleavages were observed at nucleotide positions 6 and 9 from the terminus on U3 but not on U5, suggesting independent assembly events. Protein-protein cross-linking of IN within these complexes revealed the presence of dimers, tetramers, and a larger multimer (>120 kDa). Our results suggest a new model where two IN dimers individually assemble on U3 and U5 ends before the non-covalent juxtaposition of two viral DNA ends, producing the synaptic complex.


Figures

Fig. 1
Fig. 1
HIV-1 IN-LTR DNA complexes that produce the concerted integration product. (a) The assembly pathway for SC and STC that results in the concerted or FS integration product is shown. Other strand transfer side-reactions produce the CHS, Y-type, and D-D products (see c). (b) The integration reaction with 5′-Cy3-U5 blunt-ended DNA (3 nM) and 60 nM IN was carried out for 30 min for SC (lane 1) and 120 min for STC (lane 2). Samples were subjected to native agarose electrophoresis. The Typhoon laser scan was set for excitation and emission band for Cy3. (c) The same samples were deproteinized and subjected to electrophoresis, followed by laser scanning. Lanes 3 and 4 are the 30 min and 120 min reactions, respectively. The percentage of Cy3-U5 DNA incorporated into the FS, CHS, and D-D products after 120 min were 16%, 7%, and 6%, respectively.
Fig. 2
Fig. 2
Fluorescence emission spectra and FRET signal intensities of HIV-1 IN-viral DNA complexes. (a) Spectra of quenched emission of donor fluorophore (Cy3) and sensitized emission of acceptor fluorophore (Cy5) resulting from energy transfer is shown. An equimolar (1.5 nM each) mixture of 1.6 kb Cy3-U5 and Cy5-U5 blunt-ended DNA substrates were titrated with IN (0, 20, 30, 40, 50, and 60 nM; black, red, green, yellow, blue and magenta lines, respectively). After a 2 h reaction at 37°C and adjustment of the mixture to 500 mM NaCl and 14°C, the spectra of the mixture was taken in the region 560 nm to 720 nm. All spectra are instrument and buffer corrected. b. Quenched FRET at 568 nm and sensitized FRET signal intensities at 670 nm were determined at each IN concentration by subtracting corresponding emission intensity from the sample with no IN (black line spectra shown in (a). The data at each IN concentration were plotted (20, 30, 40, 50, and 60 nM IN). Similar analyses using fluorophore labeled non-LTR DNA at 20, 40 and 60 nM IN were performed (spectra not shown).
Fig. 3
Fig. 3
Energy transfer occurs in HIV-1 SC and STC as analyzed by in-gel FRET. Panel a, b, and c show the sensitized FRET, quenched FRET, and a SYBR Gold stained photograph of the same gel, respectively. The 5′-end of 1.6 kb U5 blunt-ended substrate was labeled with Cy3 or Cy5. Assembly and incubation conditions were described in Fig. 1b. For FRET analysis, 3 nM Cy3-U5 (lanes 1–6), 1.5 nM Cy3-U5 and 1.5 nM Cy5-U5 (lanes 7–12), and 3 nM Cy5-U5 (lanes 13–18) were incubated with increasing concentrations of IN (top triangles). Lanes 19–22 were with U5 substrate (3 nM) without fluorophore label. To detect SC, the samples in lanes 2–5, 8–11, 14–17, 20–21 were incubated for 20 min at 37°C. As an activity control to detect STC, lanes 6, 12, 18, and 22 were incubated for 120 min. In each of the following sets of lanes: 1–6, 7–12 and 13–18, the IN concentrations were 0, 20, 40, 60, 80, and 80 nM, respectively. The IN concentrations in lanes 19 to 22 were 0, 40, 80 and 80 nM, respectively. The fluorescence intensity of a particular nucleoprotein complex band was calculated using ImageQuant 5.2 software. In c), T1 and T2 on the right are supercoiled and nicked circular forms of target DNA, respectively. Two kb DNA marker (M) lanes are shown. Sensitized and quenched FRET signal intensities were plotted for SC (d) and STC (e)(see details in Materials and Methods). The FRET data for STC were derived from independent experiments using the same assay conditions but incubation was for 120 min at 37°C.
Fig. 4
Fig. 4
DNaseI footprint analysis of SC, H-SC, and STC formed with U5 DNA. (a) IN-32P-DNA complexes were assembled for 30 min at 37°C in the presence of target and then treated with DNaseI prior to electrophoresis on the native agarose gel at 4°C. The complexes (marked on right) were identified by SYBR Gold staining. Lane 1 (30 μl) was not digested with DNaseI (−) while preparative lanes 3 and 4 were digested (+). A kb marker (M) ladder is in lane 2 and the sizes are marked on the left. Supercoiled, nicked circular and linear target DNA along with donor DNA are indicated on the right. SC and H-SC were excised from the preparative gel and the DNAs were purified. (b) DNA isolated from SC and H-SC was subjected to denaturing 15% polyacrylamide gel electrophoresis. Lane 1 is input naked U5 DNA without DNaseI treatment. Lanes 2 to 4 contain Maxium-Gilbert chemical sequence markers of the labeled DNA. Lanes 5 and 6 are DNaseI treated SC and H-SC, respectively. Lane 7 contains naked DNA digested with DNaseI at 0.3 units (U). Nucleotide positions are shown on the left and the bar on the right shows the ~32 bp protected region. The star indicates slight DNaseI enhanced digestion in the samples compared to the control digestion. All of the samples contain equivalent cpm. (c) The same DNaseI treatment procedure was performed on preparative amounts of STC produced after 2 h of incubation at 37°C. After DNaseI digestion (0.3 U), the STC was either isolated from an agarose gel with 1 M urea (+)(lane 1) or without urea (−)(lane 2). The isolated DNA was subjected to denaturing gel analysis. Lanes 3 and 4 contain naked DNA at 0.3 and 1 unit of DNaseI, respectively. Lane 5 is input naked viral DNA without DNaseI treatment.
Fig. 5
Fig. 5
DNaseI footprint analysis of nucleoprotein complexes that produce the CHS and FS products and, SC and H-SC formed in the presence of L-870,810. (a) The IN-DNA complexes were assembled for 2 h at 37°C and treated with DNaseI (3 min) at 14°C. An aliquot of the deproteinized sample was analyzed on a native agarose gel. The percent U5 DNA incorporated into the FS and CHS products were 29% and 11%, respectively. (b) The FS and CHS products obtained in (a) were excised and subjected to denaturing gel electrophoresis. Lanes 1 to 3 contain the U5 DNA sequence markers. Lane 4 is naked DNA digested with 0.3 U of DNaseI. Lanes 5 and 6 contain CHS and FS products, respectively. DNaseI protection is indicated by the rectangle on the right and the star indicates enhanced DNaseI cleavages in comparison to the naked DNA. Nucleotide positions are indicated on the left. (c) IN-DNA complexes were formed in the presence of 750 nM of L-870-810 for 2 h at 37°C. Samples were then treated with DNaseI and SC and H-SC were separated on an agarose gel. DNA purified from SC and H-SC was analyzed on a denaturing gel. Lane 1 is input naked viral DNA without DNaseI treatment. Lanes 2 to 4 are the chemical markers of U5 DNA. Lane 5 contains naked DNA treated with DNaseI (0.3 units). Lanes 6 and 7 are DNA purified from H-SC and SC formed in presence of 750 nM of inhibitor, respectively. Protection is indicated by rectangle on the right and the star indicates enhanced DNaseI cleavages. The nucleotide positions are shown on the left.
Fig. 6
Fig. 6
DNaseI footprint analyses of nucleoprotein complexes with U3 DNA as substrate. The 2.4 kb 32P-U3 blunt-ended DNA (3 nM) was assembled with 80 nM of IN, followed by the addition of supercoiled DNA and incubation for 2 h at 37°C. DNaseI footprint analysis and isolation of CHS and FS products was described in Fig. 5. The percent of U3 DNA incorporated into the FS and CHS products were 16% and 12%, respectively. Lanes 1 to 3 contain chemical markers for U3 DNA. Lanes 4 and 5 contain the CHS and FS products, respectively. Lanes 6 and 7 contain naked DNA treated with DNaseI (0.3 U) for 3 and 4 min, respectively. Lane 8 contains the input DNA. The protected region in the FS product is indicated by the rectangle on the right and the enhanced DNaseI digestions at 9-G and 6-A are indicated by the stars. The small block on the right indicates a minor area that was protected by IN (lane 5) from DNaseI digestion in comparison to naked DNA (lane 6).
Fig. 7
Fig. 7
Summary of DNaseI protective footprint analyses of U5 and U3 ends in SC, H-SC, and STC. U5 and U3 terminal sequences are shown. The protected regions are indicated by the thick dark underline and the enhanced DNaseI cleavages are indicated by the arrows. The thickness of the arrow indicates the degree of enhancement observed over multiple experiments. The DNaseI footprint data for U3 were derived from both U3 alone for FS and CHS products (Fig. 6) and from the different size STC isolated on gels formed with U3 only or with unlabeled U5.
Fig. 8
Fig. 8
Multimeric structures of HIV-1 IN in SC, H-SC, and STC. (a) IN-DNA complexes were assembled for 30 min at 37°C without target DNA. The cross-linked (25 μM BS3) samples were subjected to native agarose gel electrophoresis. SC and H-SC were excised. The cross-linked IN subunits were eluted and concentrated. (b) Western Blot analysis of cross-linked IN. IN was detected using rabbit polyclonal antiserum directed against an N-terminal peptide of HIV-1 IN (residues 1–16). Lane 1 contains ~25 ng of BS3 (25 μM) cross-linked IN at 50 nM without DNA; no polyethylene glycol was present in the reaction mixture. Lanes 2 and 4 are SC and H-SC, respectively. Lane 3 is molecular weight protein markers (M) whose sizes are indicated on the left. The IN monomer, dimer, tetramer, and larger-size multimer are indicated in the middle. Lanes 7, 8, and 9 contain the SC, H-SC, and STC, respectively, obtained after cross-linking the IN-DNA complexes with glutaraldehyde (50 μM). Lane 5 contains glutaraldehyde cross-linked IN (~25 ng) without DNA. The molecular weight protein markers (lane 6) are identified on the extreme left. (c) The same protocol as described above with BS3 was used except equal aliquots of SC and H-SC from the same reaction were subjected to electrophoresis and transfer. The nitrocellulose sheet was cut into half and analyzed. The sheets were probed with N-terminal antiserum (lane 2 and 4) or C-terminal antiserum (lane 7 and 8) directed against IN residues 276–288. Lanes 1 and 6 were cross-linked IN without DNA. Protein markers (lanes 3 and 5) were described above. An independent experiment of H-SC cross-linked with BS3 is shown in lane 9.
Fig. 9
Fig. 9
Assembly model for HIV-1 SC. The HIV-1 IN dimer is shown as a single blue sphere and the 1.6 kb U5 blunt-ended DNA as a red box with an extended black line. The assembly of two adjacent IN dimers on each of two LTR substrates is required prior to their juxtaposition forming the transient SC, which is a time and temperature-dependent process ,. The active tetramer of IN (circled by a pink oblong loop) responsible for catalysis is formed by the juxtaposition of two LTR ends in the SC. The large-size multimer presumably arises by cross-linking of a tetramer to one or more dimers.

References

    1. Brown PO. Integration. In: Coffin JM, Hughes S, Varmus H, editors. Retroviruses. Cold Spring Harbor Laboratory Press; Cold Spring Harbor, NY: 1997. pp. 161–203. - PubMed
    1. Miller MD, Farnet CM, Bushman FD. Human immunodeficiency virus type 1 preintegration complexes: studies of organization and composition. J Virol. 1997;71:5382–5390. - PMC - PubMed
    1. Chen H, Wei SQ, Engelman A. Multiple integrase functions are required to form the native structure of the human immunodeficiency virus type I intasome. J Biol Chem. 1999;274:17358–17364. - PubMed
    1. Wei SQ, Mizuuchi K, Craigie R. Footprints on the viral DNA ends in moloney murine leukemia virus preintegration complexes reflect a specific association with integrase. Proc Natl Acad Sci U S A. 1998;95:10535–10540. - PMC - PubMed
    1. Brown HE, Chen H, Engelman A. Structure-based mutagenesis of the human immunodeficiency virus type 1 DNA attachment site: effects on integration and cDNA synthesis. J Virol. 1999;73:9011–9020. - PMC - PubMed

Publication types

MeSH terms

LinkOut - more resources