. 2009 Jun;75(4):331-45.
doi: 10.1016/j.tpb.2009.04.001. Epub 2009 Apr 9.

An approximate likelihood for genetic data under a model with recombination and population splitting

Affiliations

An approximate likelihood for genetic data under a model with recombination and population splitting

D Davison et al. Theor Popul Biol. 2009 Jun.

Abstract

We describe a new approximate likelihood for population genetic data under a model in which a single ancestral population has split into two daughter populations. The approximate likelihood is based on the 'Product of Approximate Conditionals' likelihood and 'copying model' of Li and Stephens [Li, N., Stephens, M., 2003. Modeling linkage disequilibrium and identifying recombination hotspots using single-nucleotide polymorphism data. Genetics 165 (4), 2213-2233]. The approach developed here may be used for efficient approximate likelihood-based analyses of unlinked data. However our copying model also considers the effects of recombination. Hence, a more important application is to loosely-linked haplotype data, for which efficient statistical models explicitly featuring non-equilibrium population structure have so far been unavailable. Thus, in addition to the information in allele frequency differences about the timing of the population split, the method can also extract information from the lengths of haplotypes shared between the populations. There are a number of challenges posed by extracting such information, which makes parameter estimation difficult. We discuss how the approach could be extended to identify haplotypes introduced by migrants.


Figures
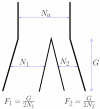
Figure 1
Figure 1. Our model of population splitting without gene flow
Here, Na, N1 and N2 indicate the haploid effective population sizes in the ancestral population, and in the two daughter populations, respectively. G is the number of generations since the split of populations 1 and 2. The parameters F1 and F2 represent the amount of drift in the two daughter populations since the split.
Figure 2
Figure 2. A schematic depiction of the copying process of our model at a single site
The figure depicts the situation when computing the approximate conditional probability of the seventh haplotype, having already added three haplotypes from each population into the sample (k1 = k2 = 3). The left side (red) illustrates a possible genealogy of the previously sampled haplotypes (although note that we do not model the genealogy explicitly). The right side (blue) illustrates our approximate copying model for a new haplotype sampled in population 2. With probability p(S = d) the lineage coalesces within the daughter population. In our approximate copying model this occurs at a fixed time td=E(TcoalS=d), and the new haplotype copies any of the existing k2 haplotypes with equal probability. Otherwise, the new lineage survives back into the ancestral population (state S = a). In that case, it coalesces with a lineage from either population, at fixed time ta=E(TcoalS=a). The copying probabilities are weighted to reflect the different fixation rates in the two populations; the weighting factor involves the expected proportion E(Jp(J1+J2)), where Jp is the unknown number of ancestral lineages entering the ancestral population from population p. This expected proportion will differ from 12 if k1k2 (as well as in the asymmetric drift case, F1F2).
Figure 3
Figure 3. The copying process in the new PAC model for loosely linked data illustrated with an example path through the missing data
A new haplotype is added to a sample of four (k1 = 2, k2 = 2; population labels are given on the right hand side). At each site along the haplotypes, small circles represent which of the two alleles is present (filled or open). Each of the 4 haplotypes has its own color. The new haplotype at the bottom is made up as a mosaic of these colors, indicating which of the four haplotypes is copied at each site (X1, X2, …, XL), and letters (d and a) indicate which level this copying occurs at (S1, S2, …, SL). For each of the 5 copied sections, a schematic genealogy is drawn above that might correspond to the state of the copying process below. In the trees, the new lineage is depicted in black. Although the relationships of the colored lines in the genealogies are depicted as remaining the same, note that this is not an assumption of the model.
Figure 4
Figure 4. A comparison of log likelihood curves for F between the PAC (black) and coalescent (red) models
The set of panels show results for all distinct allele count configurations at a single SNP. Each panel shows log likelihood surfaces for a data set at a single SNP, with 10 allele copies sampled from each population. Within each panel, the x axis ranges from F = 0 to F = 0.7; y-axis values range upwards from 2 log-likelihood units below the maximum. Average PAC likelihood surfaces are in black (individual orderings in grey); coalescent likelihood surfaces are in red. The integers along the bottom and left-hand side of the plot are minor-allele counts in the two populations, specifying the data which were used to compute the likelihood surfaces in the corresponding panel. For example, the panel which lies in the row labelled 2 and in the column labelled 4 corresponds to a data set in which there are 4 copies of the minor allele out of 10 in population 1, and 2 copies out of 10 in population 2.
Figure 5
Figure 5. Inference for F in the unlinked model using the PAC (black) and coalescent (red) models
The plots show relative log likelihood surfaces for two data sets of 60 unlinked SNPs each. The vertical dotted lines indicate the value of F used to simulate data. Results from the PAC likelihood are plotted in black (different orderings in grey); the coalescent log likelihood is in red.
Figure 6
Figure 6. Unlinked model: Estimation of F
Each panel shows the distribution of MLEs for 1000 data sets simulated with the indicated value of F. Likelihoods were evaluated at points of a grid of F values with spacing 0.01. The boxplots indicate 25%, 50% and 75% quantiles. Long horizontal black bars indicate the location on the y-axis of the true value of F. For resequenced data the model was provided with the per-site value of θ used in the simulations.
Figure 7
Figure 7. Unlinked model: Estimation of F
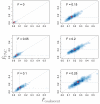
Each panel shows the joint distribution of coalescent (x-axis) and PAC (y-axis) MLEs for 1000 SNP data sets simulated with the indicated value of F. Darker colors indicate higher local density of points. Grey lines indicate the true value of F, and the line y = x. Red crosses lie at the mean value of the MLEs. Likelihoods were evaluated at points of a grid of F values with spacing 0.01.
Figure 8
Figure 8. Transitions between daughter and ancestral copying states
The four panels correspond to the four possible transitions between copying levels (dd, da, ad and aa). Within each panel, we illustrate the various classes of genealogical rearrangement that we consider when approximating the probability of that panel’s copying transition. Each class of genealogical rearrangement is illustrated by a diagram of a genealogy of two lineages (in black): the new lineage (marked with an asterisk), and the lineage that it copies at site l. In each genealogy diagram, a thick blue line represents the barrier to gene flow separating the daughter populations. At site l + 1, the lineage that is copied may be different as a result of recombination in the history of the two samples between sites l and l + 1. Red lines represent lineages at site l + 1, and the way they are drawn reflects the way in which the probability of the event being depicted depends on their fate (i.e. on when they coalesce into the rest of the genealogy). Short red rising lines indicate that the transition probability depends only on the occurrence of the recombination event, and not otherwise on the fate of the recombinant line. Long red rising lines indicate that the lineage must remain distinct and enter the ancestral population, prior to its eventual recoalescence. A horizontal terminus to the red line indicates that the line must recoalesce in the daughter population. Red lines without an initial horizontal section do not require a recombination to have occurred (i.e. they already existed at site l). The five types of event are, (i) recombination on the new lineage in the daughter population, (ii) recombination on the new lineage in the ancestral population, (iii) recombination on the copied lineage in the daughter population, (iv) recombination on the copied lineage in the ancestral population, (v) no interrupting event (note that this last event can only contribute to the probability of ‘transitions’ to the same haplotype at the same level (s′ = s, i′ = i)).
Figure 9
Figure 9. Dependence of ρ^pac on ρ
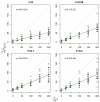
60 SNPs were simulated using the specified value of ρ for the region, for four different values of F. When fitting the model to estimate ρ^pac for each region, F was fixed at its true value. The line y = x is shown in light gray. The results of a linear regression of ρ^pac on ρ are shown as a black line and an equation in each panel.
Figure 10
Figure 10. Linkage model: Estimation of F (symmetric drift, SNP data)
The x-axis indicates the value of F used to simulate the data. For each value of F, 200 data sets of 60 SNPs were simulated with 4Nr = 2ρ = 50. Above each value of F, distributions of F^pac MLEs are illustrated with boxplots. The 3 boxplots correspond to different values of ρ used when fitting the model. The boxplots indicate 25%, 50% and 75% quantiles of the MLEs and the mean MLEs are indicated by a solid black dots. Horizontal black bars indicate the location on the y-axis of the true value of F.
Figure 11
Figure 11. Bias correction under the linkage model
The figure shows the distribution of MLEs for 100 data sets simulated with the value of F indicated along the x axis. The boxplots indicate 25%, 50% and 75% quantiles of the MLEs and the mean MLEs are indicated by solid black dots. Horizontal blue bars indicate the location on the y-axis of the true value of F. MLEs from the bias-corrected linkage model (see text) are shown in blue. MLEs resulting from analysing the same data under the no-linkage model are shown in red.
Figure 12
Figure 12. Visualizing migrant chunks of chromosome
Each row in the figure represents a single haplotype, colored to indicate the posterior probability that copying is ancestral (Sl = a) when that haplotype is added as the final haplotype in the sample. 20 haplotypes were simulated from each of two populations that separated F = 0.15 units of drift-scaled time ago. We simulated 900 SNPs across a 900kb region with a population-scaled recombination rate of 4Nr = 1 per kb. To create a stretch of migrant haplotype (marked by short black vertical lines) the middle third of the first haplotype in each population was replaced by a haplotype simulated from the other population.

References

    1. Adams AM, Hudson RR. Maximum-likelihood estimation of demographic parameters using the frequency spectrum of unlinked single-nucleotide polymorphisms. Genetics. 2004;168:1699–1712. - PMC - PubMed
    1. Anderson EC, Slatkin M. Estimation of the number of individuals founding colonized populations. Evolution. 2007;61(4):972–983. - PubMed
    1. Beaumont MA, Zhang W, Balding DJ. Approximate Bayesian computation in population genetics. Genetics. 2002;162(4):2025–35. - PMC - PubMed
    1. Becquet C, Przeworski M. A new approach to estimate parameters of speciation models with application to apes. Genome Research. 2007;17(10):1505–1519. - PMC - PubMed
    1. Becquet C, Przeworski M. Learning about modes of speciation from computational approaches. Evolution. 2009 In Press. - PubMed

Publication types

LinkOut - more resources