Comparative Study
. 2009 Jun 15;237(3):317-30.
doi: 10.1016/j.taap.2009.04.002. Epub 2009 Apr 9.

Synergistic drug-cytokine induction of hepatocellular death as an in vitro approach for the study of inflammation-associated idiosyncratic drug hepatotoxicity

Affiliations
Comparative Study

Synergistic drug-cytokine induction of hepatocellular death as an in vitro approach for the study of inflammation-associated idiosyncratic drug hepatotoxicity

Benjamin D Cosgrove et al. Toxicol Appl Pharmacol. .

Abstract

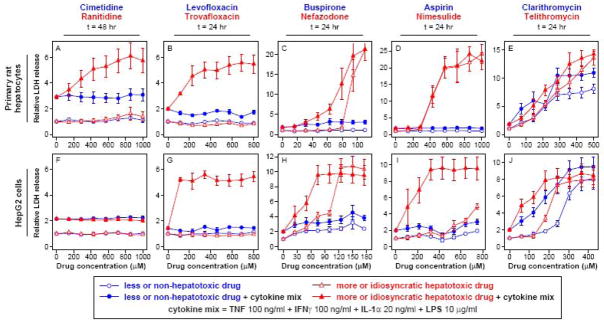
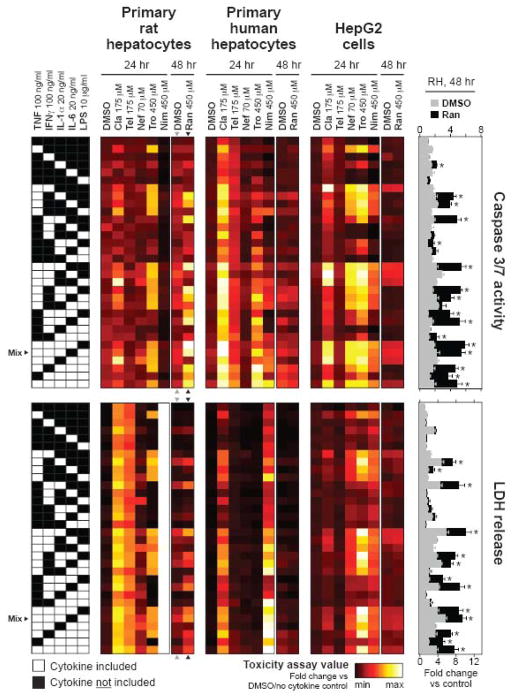
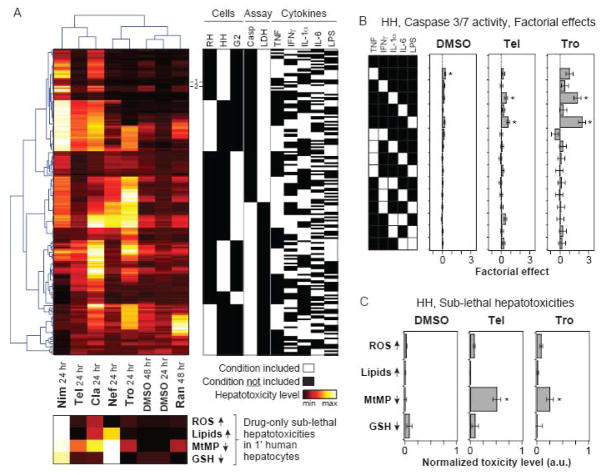
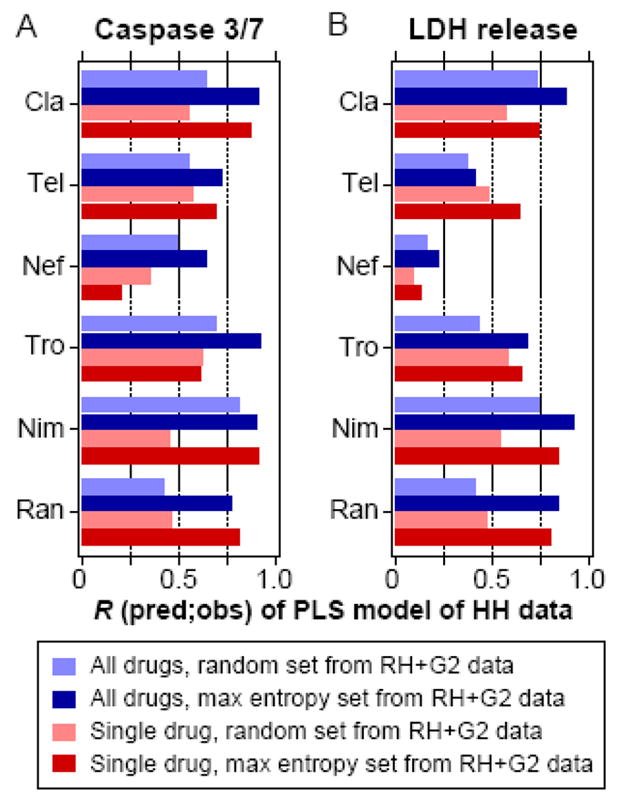
Idiosyncratic drug hepatotoxicity represents a major problem in drug development due to inadequacy of current preclinical screening assays, but recently established rodent models utilizing bacterial LPS co-administration to induce an inflammatory background have successfully reproduced idiosyncratic hepatotoxicity signatures for certain drugs. However, the low-throughput nature of these models renders them problematic for employment as preclinical screening assays. Here, we present an analogous, but high-throughput, in vitro approach in which drugs are administered to a variety of cell types (primary human and rat hepatocytes and the human HepG2 cell line) across a landscape of inflammatory contexts containing LPS and cytokines TNF, IFN gamma, IL-1 alpha, and IL-6. Using this assay, we observed drug-cytokine hepatotoxicity synergies for multiple idiosyncratic hepatotoxicants (ranitidine, trovafloxacin, nefazodone, nimesulide, clarithromycin, and telithromycin) but not for their corresponding non-toxic control compounds (famotidine, levofloxacin, buspirone, and aspirin). A larger compendium of drug-cytokine mix hepatotoxicity data demonstrated that hepatotoxicity synergies were largely potentiated by TNF, IL-1 alpha, and LPS within the context of multi-cytokine mixes. Then, we screened 90 drugs for cytokine synergy in human hepatocytes and found that a significantly larger fraction of the idiosyncratic hepatotoxicants (19%) synergized with a single cytokine mix than did the non-hepatotoxic drugs (3%). Finally, we used an information theoretic approach to ascertain especially informative subsets of cytokine treatments for most highly effective construction of regression models for drug- and cytokine mix-induced hepatotoxicities across these cell systems. Our results suggest that this drug-cytokine co-treatment approach could provide a useful preclinical tool for investigating inflammation-associated idiosyncratic drug hepatotoxicity.


Conflict of interest statement

Conflict of interest statement

B.S.H. is employed by and holds stock in Pfizer. J.J.X. was a past employee of Pfizer, is employed by Merck & Co., and owns stock in Pfizer, Merck & Co., and other biopharmaceutical companies.

Figures

Figure 1
Figure 1
Identification of drug dose-dependent hepatotoxicity synergies between a cytokine mix and multiple idiosyncratic hepatotoxic drugs in primary rat hepatocytes (panels A-E) and HepG2 cells (panels F-J). Primary rat hepatocytes and HepG2 cells were cultured, treated, and assayed for LDH (at 24 or 48 hours post-treatment) as described in Methods. Drugs were dosed at varying concentrations in the presence or absence of a cytokine mix containing 100 ng/ml TNF, 100 ng/ml IFNγ, 20 ng/ml IL-1α, and 10 μg/ml LPS. LDH release values were fold-change normalized to DMSO/no cytokine control samples from the same cell system. (Note that LDH release axes are separately scaled for each plot.) Drugs from similar chemical class and/or molecular target are plotted together, with the less or non-hepatotoxic “comparison” drug in blue and the more idiosyncratic hepatotoxic drug in red. Data are presented as mean ± SEM of four biological samples. Results from additional time points, with drug doses plotted with respect to both molecular concentrations and drug Cmax values, are shown in Figures S1–S5.
Figure 2
Figure 2
A drug- and cytokine mix-induced hepatotoxicity data compendium. Primary rat hepatocytes (far left), primary human hepatocytes (left center), and HepG2 cells (right center) were cultured, treated, and assayed for caspase 3/7 activity (top) or LDH release (bottom) at 24 or 48 hours post-treatment as described in Methods. In rat hepatocytes, the DMSO control and ranitidine treatment conditions at t = 48 hr are shown in expanded bar plots for both assay types (far right). Bar plot graphs for all combinations of cell type, assay type, and treatment condition are shown in Figures S7-S9. Caspase 3/7 activity and LDH release values were both fold-change normalized to DMSO/no cytokine samples from the same cell system. In the heatmaps, mean toxicity assay values of three to six biological samples are plotted using linear color-scales indexed separately to the minimum and maximum observed value for each combination of cell system and assay type. In the bar plots, data are plotted as mean ± SEM of four biological samples, with all conditions demonstrating statistically significant supra-additive drug-cytokine mix synergy labeled (*) (see Methods). The cytokine mix (TNF, IFNγ, IL-1α, and LPS) used in Figures 1 and S1-S5 is noted as “Mix”. Abbreviations: Cla, clarithromycin; Tel, telithromycin; Nef, nefazodone; Tro, trovafloxacin; Nim, nimesulide; Ran, ranitidine.
Figure 3
Figure 3
Hierarchical clustering of the drug-cytokine mix hepatotoxicity compendium. (A) The drug-cytokine mix combinatorial hepatotoxicity compendium was fused across all cell systems and assay types into a single data matrix, which was then subjected to two-way Pearson clustering (top left; see Methods for additional details). First, clustering was used to re-sort a matrix of 192 “experimental” conditions, comprised of combinations of three cell systems, two assay types, and five cytokine treatment variables (top right). Second, this clustering was used re-sort to a sub-lethal hepatotoxicity data matrix of eight drug conditions and four drug (only)-induced sub-lethal hepatotoxicities (bottom). The sub-lethal hepatotoxicities (measured by quantitative imaging in primary human hepatocytes; see Figure S16) are plotted in the bottom heatmap using linear color-scales indexed separately to the minimum and maximum observed toxicity value for each assay type. (Note that the MtMP and GSH assay scales are inverted compared to Figures S16K-L.) Conditions used for the large-scale primary human hepatocyte toxicity study (see Figure 4) are noted: (1) no cytokines and (2) TNF, IL-1α, IL-6, and LPS. (B) Factorial effects ± errors of all one- and two-cytokine effects from the caspase 3/7 activity data at t = 24 hr in primary human hepatocytes for DMSO control, telithromycin, and trovafloxacin drug treatments. Statistically significant factorial effects (see Methods and Figure S12) are labeled (*). (C) Sub-lethal hepatotoxicities measured in primary human hepatocytes treated with DMSO control, telithromycin, or trovafloxacin are plotted on a normalized scale as in panel (A). Data are presented as mean ± SEM of five biological samples. For each assay type, treatments significantly different from the DMSO control are labeled as significant (*) if P < 0.05 by a Student’s t test. Abbreviations: RH, primary rat hepatocytes; HH, primary human hepatocytes; G2, HepG2 cells; Cla, clarithromycin; Tel, telithromycin; Nef, nefazodone; Tro, trovafloxacin; Nim, nimesulide; Ran, ranitidine; ROS, reactive oxygen species; MtMP, mitochondrial membrane potential; GSH, glutathione.
Figure 4
Figure 4
Large-scale drug-cytokine mix hepatotoxicity study in primary human hepatocytes demonstrates the utility of cytokine co-treatment approach for identifying idiosyncratic hepatotoxic drugs. Primary human hepatocytes were cultured, treated, and assayed for LDH release (at 24 hours post-treatment) as described in Methods. Ninety drugs (see Table S3) were each dosed at seven non-zero concentrations (2.5× serial dilutions from a high concentration of 150 μM) in the presence or absence of a cytokine mix containing TNF, IL-1α, IL-6, and LPS. The differential between + and - cytokine mix co-treatment for each drug dose was calculated and is plotted in the heatmaps (see Figure S17 for raw data and additional details). The heatmaps are split into hepatotoxic (DILI classes P1, O1, and P2; left) and not or minimally hepatotoxic (DILI classes O2, N3, N2, and N1; right) drug groups, with these DILI classes sorted in order of decreasing hepatotoxicity (see Tables 1 and S1 for additional details). Note that DILI class P2 is substantially comprised of drugs with idiosyncratic hepatotoxicities in humans. Within each DILI class, drugs are sorted in order of 100*Cmax value (a physiologically relevant dosing limit). Drug 100*Cmax values are plotted in an overlayed line plot, with values exceeding 150 μM not shown. Individual drug doses that exhibited supra-additive drug-cytokine mix synergy (see Methods and Table 1) at concentrations less than their drug’s 100*Cmax limit are highlighted with gray boxes. Drugs with one or more dose exhibiting drug-cytokine mix supra-additive toxicity synergy at less than their 100*Cmax concentration are listed in red font. A representative DILI P2 drug (chlorpromazine) displaying drug-cytokine mix synergy at dosing concentrations less than 100*Cmax is shown in the expanded plot at the bottom right (data presented mean ± SEM of two biological samples). TPCA-1, a small molecule IKK inhibitor (IKKi), was used (at ten-fold lower concentrations than are noted by the axis labels for the other drugs) as a positive control for drug-cytokine mix synergy, but is not labeled in red as its Cmax is unknown.
Figure 5
Figure 5
Representative subset identification using joint entropy analysis. In panel A, subsets of cytokine co-treatments that maximally maintained the diversity of the full experimental human hepatocyte (HH) data set were identified by exhaustively scoring all possible subsets that contained the no cytokine and single-cytokine/LPS treatment conditions. The treatments contained in the highest scoring set of each size are indicated by the white boxes. Red bars represent the joint entropy of the maximally informative set. After 16–19 co-treatments are selected, additional co-treatments do not increase the joint entropy, indicating that the diversity of the full data set can be captured with a well-chosen set of 16–19 co-treatments. See Figure S18 for maximum entropy subset plots for the rat hepatocyte (RH) and HepG2 (G2) data sets. In panel B, maximally informative consensus subsets were chosen using only RH data, only G2 data, both RH and G2 data, or only HH data. The mean performance of the top 100 subsets chosen from each cell system when scored for joint entropy in the HH data is plotted, along with the mean and standard deviation joint entropy for all possible subsets for the HH data. Sets chosen based on RH and G2 data still perform well when scored against the HH data. In panel C, a single consensus set of each size was chosen from each cell system and the scored for joint entropy in the HH data. The probability of randomly choosing a subset with higher joint entropy is plotted as a function of set size. Low values indicate that it is unlikely to randomly select a set with higher information content than the evaluated set. The dashed line represents the average of all possible subsets.
Figure 6
Figure 6
Predictive performance of partial least-squares (PLS) models trained on consensus maximum entropy sets and evaluated across cell systems. PLS regression models were built using specific cytokine condition sets containing 25 of the 32 possible cytokine treatments, selected based on data from rat hepatocytes (RH) and HepG2 cells (G2). They were evaluated for their ability to predict responses of the 7 remaining cytokine treatment conditions observed in human hepatocytes (HH). Pearson correlations (R) between the observed and predicted responses in HH of both the caspase 3/7 activity (panel A) and LDH release (panel B) responses are shown. Cytokine condition sets selected from RH and G2 data were chosen using either the consensus maximum entropy treatment sets or random treatment sets, of which the mean performance of 1000 random treatment sets is plotted, and these conditions sets were selected and evaluated using data from either all six drugs or single drugs. Abbreviations: Cla, clarithromycin; Tel, telithromycin; Nef, nefazodone; Tro, trovafloxacin; Nim, nimesulide; Ran, ranitidine.

References

    1. Bellezzo JM, Britton RS, Bacon BR, Fox ES. LPS-mediated NF-kappa beta activation in rat Kupffer cells can be induced independently of CD14. Am J Physiol. 1996;270:G956–961. - PubMed
    1. Bergheim I, Luyendyk JP, Steele C, Russell GK, Guo L, Roth RA, Arteel GE. Metformin prevents endotoxin-induced liver injury after partial hepatectomy. J Pharmacol Exp Ther. 2006;316:1053–1061. - PubMed
    1. Box GEP, Hunter WG, Hunter JS. Statistics for experimenters. Wiley; New York: 1978.
    1. Buchweitz JP, Ganey PE, Bursian SJ, Roth RA. Underlying endotoxemia augments toxic responses to chlorpromazine: is there a relationship to drug idiosyncrasy? J Pharmacol Exp Ther. 2002;300:460–467. - PubMed
    1. Clay KD, Hanson JS, Pope SD, Rissmiller RW, Purdum PP, 3rd, Banks PM. Brief communication: severe hepatotoxicity of telithromycin: three case reports and literature review. Ann Intern Med. 2006;144:415–420. - PubMed

Publication types

MeSH terms