. 2009 Jun 12;284(24):16146-16155.
doi: 10.1074/jbc.M109.005546. Epub 2009 Apr 9.

Antibiotic resistance in Mycobacterium tuberculosis: peroxidase intermediate bypass causes poor isoniazid activation by the S315G mutant of M. tuberculosis catalase-peroxidase (KatG)

Affiliations

Antibiotic resistance in Mycobacterium tuberculosis: peroxidase intermediate bypass causes poor isoniazid activation by the S315G mutant of M. tuberculosis catalase-peroxidase (KatG)

Javier Suarez et al. J Biol Chem. .

Abstract

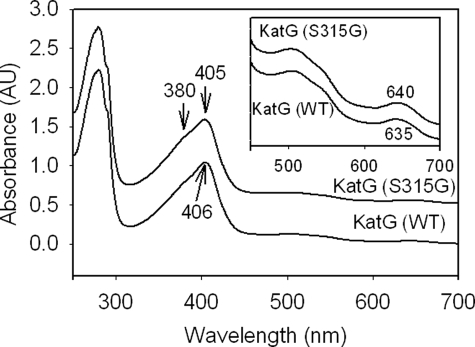
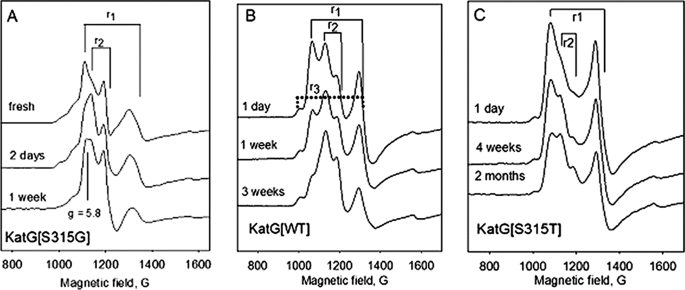
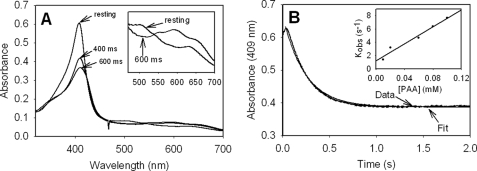
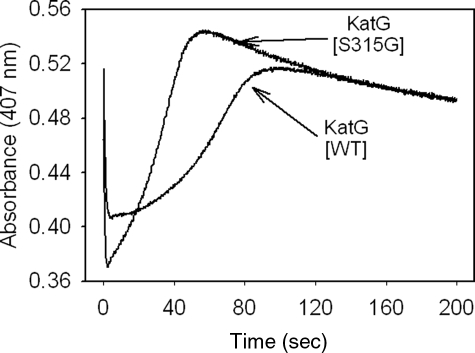
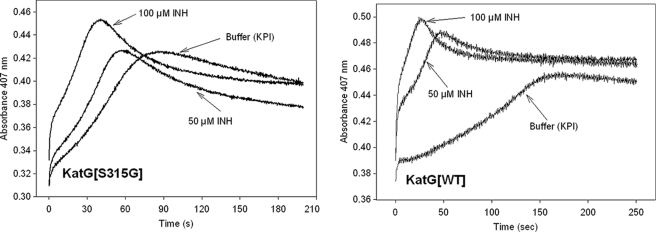
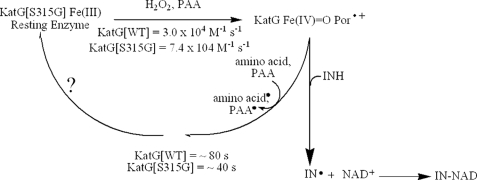
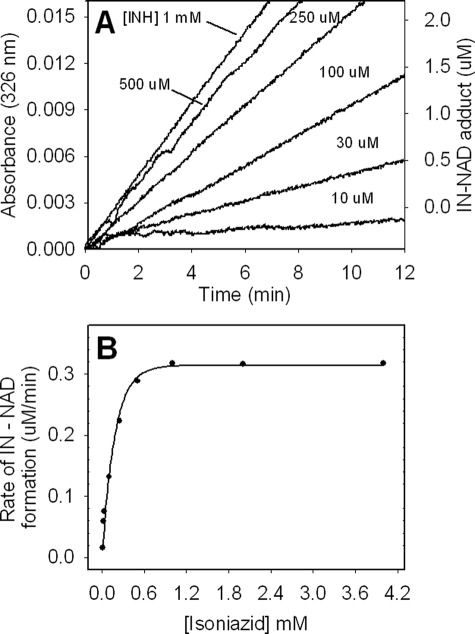
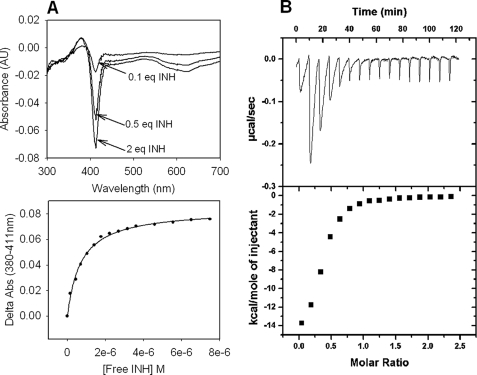
KatG (catalase-peroxidase) in Mycobacterium tuberculosis is responsible for activation of isoniazid (INH), a pro-drug used to treat tuberculosis infections. Resistance to INH is a global health problem most often associated with mutations in the katG gene. The origin of INH resistance caused by the KatG[S315G] mutant enzyme is examined here. Overexpressed KatG[S315G] was characterized by optical, EPR, and resonance Raman spectroscopy and by studies of the INH activation mechanism in vitro. Catalase activity and peroxidase activity with artificial substrates were moderately reduced (50 and 35%, respectively), whereas the rates of formation of oxyferryl heme:porphyrin pi-cation radical and the decay of heme intermediates were approximately 2-fold faster in KatG[S315G] compared with WT enzyme. The INH binding affinity for the resting enzyme was unchanged, whereas INH activation, measured by the rate of formation of an acyl-nicotinamide adenine dinucleotide adduct considered to be a bactericidal molecule, was reduced by 30% compared with WT KatG. INH resistance is suggested to arise from a redirection of catalytic intermediates into nonproductive reactions that interfere with oxidation of INH. In the resting mutant enzyme, a rapid evolution of 5-c heme to 6-c species occurred in contrast with the behavior of WT KatG and KatG[S315T] and consistent with greater flexibility at the heme edge in the absence of the hydroxyl of residue 315. Insights into the effects of mutations at residue 315 on enzyme structure, peroxidation kinetics, and specific interactions with INH are presented.


Figures

FIGURE 1.
FIGURE 1.
UV-visible spectrum of resting (ferric) WT KatG and KatG[S315G]. Optical absorption spectra of 10 μm wild-type KatG and KatG[S315G] in 20 mm potassium phosphate buffer, pH 7.2, at 25 °C are shown. Spectra are offset for presentation purposes. Differences in the absorbance maxima marked by arrows are relevant to the greater abundanceof 5-c heme in the mutant. AU, absorbance units. Inset, expanded visible region of spectra.
FIGURE 2.
FIGURE 2.
Low temperature EPR spectra as a function of storage time after purification. A, KatG[S315G]; B, wild-type KatG; C, KatG[S315T] (from Ref. 43). Experimental conditions were as follows: temperature, 4 K; microwave power, 1 milliwatt; modulation amplitude, 4 G; frequency, 9.38 GHz. g-value assignments are as follows: for r2, g1 = 6.04, g2 = 5.54, and g3 ∼ 2.00; for r1, g1 = 6.30, g2 = 5.1, and g3 ∼ 2; for r3, g1 = 6.68, g2 = 5.1, and g3 ∼ 2 was present in each case.
FIGURE 3.
FIGURE 3.
Formation of Fe(IV)=OPor+· in KatG[S315G]. A, absorption spectra recorded for resting enzyme and after the addition of 25 μm PAA to 5 μm (final concentrations) resting enzyme in 20 mm potassium phosphate buffer, pH 7.2, at 25 °C in a stopped-flow experiment; B, absorbance versus time recorded at 409 nm. The time course at 409 nm was fitted with a first order exponential decay function. Inset, linear dependence of the observed rates (kobs) on PAA concentration, giving a second order rate constant equal to 7.4 × 10⁴ m−1 s−1.
FIGURE 4.
FIGURE 4.
Formation and decay of Fe(IV) = OPor+· in WT KatG and KatG[S315G].5 Extended time traces (at 407 nm) recorded after mixing 5 μm resting WT KatG or KatG[S315G] with 25 μm PAA (final concentrations) in 20 mm potassium phosphate buffer, pH 7.2, at 25 °C. The initial rapid decrease is followed by the slow return to the starting absorbance value around 0.5.
FIGURE 5.
FIGURE 5.
Reaction of WT KatG (right) and KatG[S315G] Fe(IV) = OPor+· (left) with INH.5 Absorbance versus time traces (at 407 nm) for double mixing stopped-flow experiments are shown. Resting enzymes were prereacted with PAA to form Fe(IV) = OPor+·, followed by the addition of increasing concentrations of INH. The final concentrations of enzyme and PAA were 5 and 25 μm, respectively; the final concentrations of INH are as labeled in the figure for each time trace.
Scheme. 1.
Scheme. 1.
Reaction pathways relevant to INH activation by KatG. Rates of Fe(IV) = OPor+· formation using PAA (7.4 × 10⁴ m−1 s−1 for KatG[S315G]; 3.0 × 10⁴ m−1 s−1 for WT KatG) and decay of heme intermediates back to resting enzyme (40 s, KatG[S315G]; 80 s, WT KatG) are shown. Results suggest that increased rate or efficiency of single electron reactions with peroxide(s) leads to a decreased activation (oxidation) of INH and therefore to decreased IN-NAD adduct formation, ultimately producing drug resistance in strains harboring the S315G mutation.
FIGURE 6.
FIGURE 6.
Effect of INH concentration on the rate of production of the IN-NAD adduct. A, IN-NAD adduct formation was followed at 326 nm. KatG[S315G] (0.5 μm), NAD+ (50 μm), and H2O2 (2 μm/min generated enzymatically using Glu/glucose oxidase were incubated with varying concentrations of INH. B, rates of IN-NAD adduct formation as a function of INH concentration.
FIGURE 7.
FIGURE 7.
Binding of INH to KatG[S315G]. A, optical titrations with INH. Optical titrations were performed using 5 μm enzyme and increasing concentrations of INH (top panel). Difference spectra were obtained by subtracting the spectrum of free KatG from that of the INH-bound enzyme for each increment of addition. Binding curves were generated by plotting the absorbance difference for the peak minus the trough absorbance values at 380 and 411 nm, respectively, versus the concentration of free INH (bottom panel). B, isothermal titration of KatG[S315G] with INH. ITC experiments were carried out at 25 °C in phosphate buffer, pH 7.2, using 10 μm KatG. The top panel shows the isothermal traces measured from a series of injections of INH into enzyme. Heat (integrated values in μcal/s/injection; lower panel) were fitted to a single binding site model. The Kd value calculated from the optical titration was 0.7 μm, and the value from the ITC titration was 1.4 μm.

Similar articles

Cited by

References

    1. Kochi A. ( 1991) Tubercle 72, 1– 6 - PubMed
    1. Robitzek E. H., Selikoff I. J. ( 1952) Am. Rev. Tuberc. 65, 402– 428 - PubMed
    1. Sepkowitz K. A. ( 2001) Emerg. Infect. Dis. 7, 259– 262 - PMC - PubMed
    1. Sepkowitz K. A. ( 1995) Clin. Infect. Dis. 20, 232– 242 - PubMed
    1. Hutchison D. C., Drobniewski F. A., Milburn H. J. ( 2003) Respir. Med. 97, 65– 70 - PubMed

Publication types

MeSH terms