

Regulation of intracellular cholesterol distribution by Na/K-ATPase
- PMID: 19363037
- PMCID: PMC2685670
- DOI: 10.1074/jbc.M109.003574
Regulation of intracellular cholesterol distribution by Na/K-ATPase
Abstract
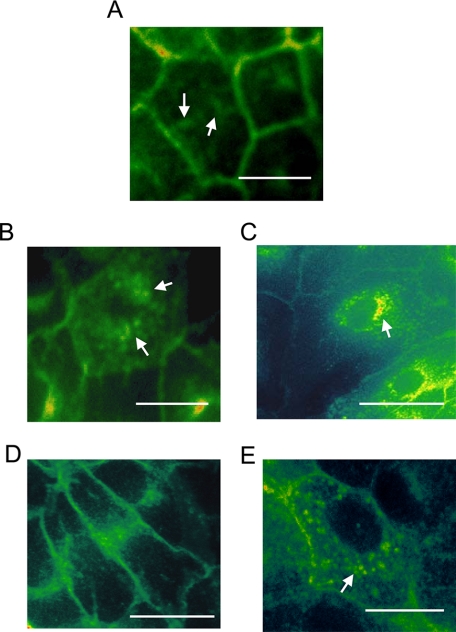
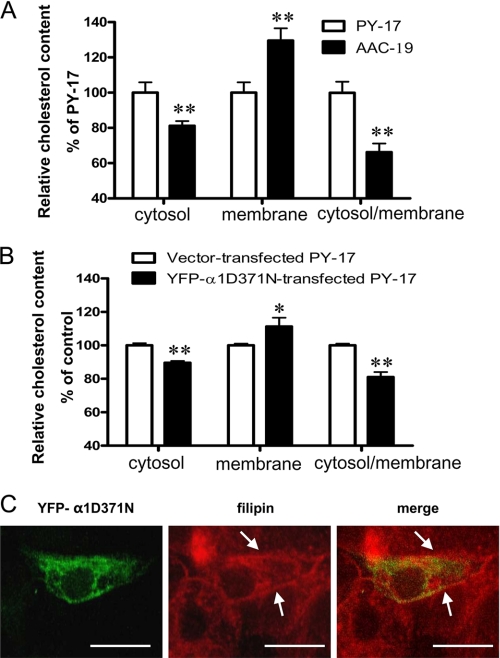
Recent studies have ascribed many non-pumping functions to the Na/K-ATPase. We show here that graded knockdown of cellular Na/K-ATPase alpha1 subunit produces a parallel decrease in both caveolin-1 and cholesterol in light fractions of LLC-PK1 cell lysates. This observation is further substantiated by imaging analyses, showing redistribution of cholesterol from the plasma membrane to intracellular compartments in the knockdown cells. Moreover, this regulation is confirmed in alpha1(+/-) mouse liver. Functionally, the knockdown-induced redistribution appears to affect the cholesterol sensing in the endoplasmic reticulum, because it activates the sterol regulatory element-binding protein pathway and increases expression of hydroxymethylglutaryl-CoA reductase and low density lipoprotein receptor in the liver. Consistently, we detect a modest increase in hepatic cholesterol as well as a reduction in the plasma cholesterol. Mechanistically, alpha1(+/-) livers show increases in cellular Src and ERK activity and redistribution of caveolin-1. Although activation of Src is not required in Na/K-ATPase-mediated regulation of cholesterol distribution, the interaction between the Na/K-ATPase and caveolin-1 is important for this regulation. Taken together, our new findings demonstrate a novel function of the Na/K-ATPase in control of the plasma membrane cholesterol distribution. Moreover, the data also suggest that the plasma membrane Na/K-ATPase-caveolin-1 interaction may represent an important sensing mechanism by which the cells regulate the sterol regulatory element-binding protein pathway.
Figures


Similar articles
-
Regulation of Na/K-ATPase expression by cholesterol: isoform specificity and the molecular mechanism.Am J Physiol Cell Physiol. 2020 Dec 1;319(6):C1107-C1119. doi: 10.1152/ajpcell.00083.2020. Epub 2020 Sep 30. Am J Physiol Cell Physiol. 2020. PMID: 32997514 Free PMC article.
-
Identification of a pool of non-pumping Na/K-ATPase.J Biol Chem. 2007 Apr 6;282(14):10585-93. doi: 10.1074/jbc.M609181200. Epub 2007 Feb 12. J Biol Chem. 2007. PMID: 17296611
-
Changes in sodium pump expression dictate the effects of ouabain on cell growth.J Biol Chem. 2009 May 29;284(22):14921-9. doi: 10.1074/jbc.M808355200. Epub 2009 Mar 27. J Biol Chem. 2009. PMID: 19329430 Free PMC article.
-
Molecular mechanisms of Na/K-ATPase-mediated signal transduction.Ann N Y Acad Sci. 2003 Apr;986:497-503. doi: 10.1111/j.1749-6632.2003.tb07234.x. Ann N Y Acad Sci. 2003. PMID: 12763870 Review.
-
Identified and potential internalization signals involved in trafficking and regulation of Na+/K+ ATPase activity.Mol Cell Biochem. 2024 Jul;479(7):1583-1598. doi: 10.1007/s11010-023-04831-y. Epub 2023 Aug 27. Mol Cell Biochem. 2024. PMID: 37634170 Free PMC article. Review.
Cited by
-
Elucidating Potential Profibrotic Mechanisms of Emerging Biomarkers for Early Prognosis of Hepatic Fibrosis.Int J Mol Sci. 2020 Jul 3;21(13):4737. doi: 10.3390/ijms21134737. Int J Mol Sci. 2020. PMID: 32635162 Free PMC article. Review.
-
NaKtide, a Na/K-ATPase-derived peptide Src inhibitor, antagonizes ouabain-activated signal transduction in cultured cells.J Biol Chem. 2009 Jul 31;284(31):21066-76. doi: 10.1074/jbc.M109.013821. Epub 2009 Jun 8. J Biol Chem. 2009. PMID: 19506077 Free PMC article.
-
Lipid-binding surfaces of membrane proteins: evidence from evolutionary and structural analysis.Biochim Biophys Acta. 2011 Apr;1808(4):1092-102. doi: 10.1016/j.bbamem.2010.12.008. Epub 2010 Dec 16. Biochim Biophys Acta. 2011. PMID: 21167813 Free PMC article.
-
Identification of a mutant α1 Na/K-ATPase that pumps but is defective in signal transduction.J Biol Chem. 2013 May 10;288(19):13295-304. doi: 10.1074/jbc.M113.467381. Epub 2013 Mar 26. J Biol Chem. 2013. PMID: 23532853 Free PMC article.
-
Modulation of Na(+)-K(+)-ATPase cell surface abundance through structural determinants on the α1-subunit.Am J Physiol Cell Physiol. 2011 Jan;300(1):C42-8. doi: 10.1152/ajpcell.00386.2010. Epub 2010 Nov 3. Am J Physiol Cell Physiol. 2011. PMID: 21048163 Free PMC article.
References
-
- Skou, J. C. (1957) Biochim. Biophys. Acta 23 394–401 - PubMed
-
- Lingrel, J. B., and Kuntzweiler, T. (1994) J. Biol. Chem. 269 19659–19662 - PubMed
-
- James, P. F., Grupp, I. L., Grupp, G., Woo, A. L., Askew, G. R., Croyle, M. L., Walsh, R. A., and Lingrel, J. B. (1999) Mol. Cell 3 555–563 - PubMed
-
- Sweadner, K. J. (1989) Biochim. Biophys. Acta 988 185–220 - PubMed
-
- Lingrel, J. B., Orlowski, J., Shull, M. M., and Price, E. M. (1990) Prog. Nucleic Acid Res. Mol. Biol. 38 37–89 - PubMed
Publication types
MeSH terms
Substances
Grants and funding
LinkOut - more resources
Full Text Sources
Other Literature Sources
Medical
Molecular Biology Databases
Miscellaneous
