

Biofilm bacterial community structure in streams affected by acid mine drainage
- PMID: 19363070
- PMCID: PMC2687311
- DOI: 10.1128/AEM.00274-09
Biofilm bacterial community structure in streams affected by acid mine drainage
Abstract
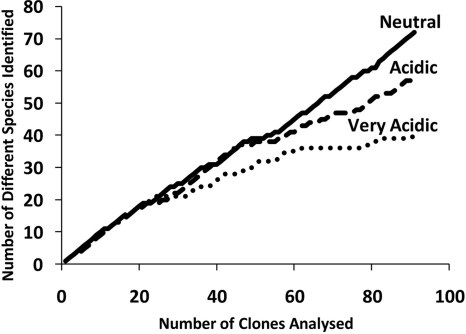
We examined the bacterial communities of epilithic biofilms in 17 streams which represented a gradient ranging from relatively pristine streams to streams highly impacted by acid mine drainage (AMD). A combination of automated ribosomal intergenic spacer analysis with multivariate analysis and ordination provided a sensitive, high-throughput method to monitor the impact of AMD on stream bacterial communities. Significant differences in community structure were detected among neutral to alkaline (pH 6.7 to 8.3), acidic (pH 3.9 to 5.7), and very acidic (pH 2.8 to 3.5) streams. DNA sequence analysis revealed that the acidic streams were generally dominated by bacteria related to the iron-oxidizing genus Gallionella, while the organisms in very acidic streams were less diverse and included a high proportion of acidophilic eukaryotes, including taxa related to the algal genera Navicula and Klebsormidium. Despite the presence of high concentrations of dissolved metals (e.g., Al and Zn) and deposits of iron hydroxide in some of the streams studied, pH was the most important determinant of the observed differences in bacterial community variability. These findings confirm that any restoration activities in such systems must focus on dealing with pH as the first priority.
Figures
References
-
- American Public Health Association. 1998. Standard method for the examination of water and wastewater, 20th ed. American Public Health Association, Washington, DC.
-
- Anderson, M. J., R. N. Gorley, and K. R. Clarke. 2008. PERMANOVA+ for PRIMER: guide to software and statistical methods. PRIMER-E Ltd., Plymouth, United Kingdom.
-
- Anderson, M. J., and T. J. Willis. 2003. Canonical analysis of principal coordinates: a useful method of constrained ordination for ecology. Ecology 84:511-525.
-
- Baker, B. J., and J. F. Banfield. 2003. Microbial communities in acid mine drainage. FEMS Microbiol. Ecol. 44:139-152. - PubMed
-
- Biggs, B. J. F., and C. Kilroy. 2000. Stream periphyton manual. New Zealand Ministry for the Environment/National Institute of Water and Atmospheric Research, Christchurch.
Publication types
MeSH terms
Substances
Associated data
- Actions
- Actions
- Actions
- Actions
- Actions
- Actions
- Actions
- Actions
- Actions
- Actions
- Actions
- Actions
- Actions
- Actions
- Actions
- Actions
- Actions
- Actions
- Actions
- Actions
- Actions
- Actions
- Actions
- Actions
- Actions
- Actions
- Actions
- Actions
- Actions
- Actions
- Actions
- Actions
- Actions
- Actions
- Actions
- Actions
- Actions
- Actions
- Actions
- Actions
- Actions
- Actions
- Actions
- Actions
- Actions
- Actions
- Actions
- Actions
- Actions
- Actions
- Actions
- Actions
- Actions
- Actions
- Actions
- Actions
- Actions
- Actions
- Actions
- Actions
- Actions
- Actions
- Actions
- Actions
- Actions
- Actions
- Actions
- Actions
- Actions
- Actions
- Actions
- Actions
- Actions
- Actions
- Actions
- Actions
- Actions
- Actions
- Actions
- Actions
- Actions
- Actions
- Actions
- Actions
- Actions
- Actions
- Actions
- Actions
- Actions
- Actions
- Actions
- Actions
- Actions
- Actions
- Actions
- Actions
- Actions
- Actions
- Actions
- Actions
- Actions
- Actions
- Actions
- Actions
- Actions
- Actions
- Actions
- Actions
- Actions
- Actions
- Actions
- Actions
- Actions
- Actions
- Actions
- Actions
- Actions
- Actions
- Actions
- Actions
- Actions
- Actions
- Actions
- Actions
- Actions
- Actions
- Actions
- Actions
- Actions
- Actions
- Actions
- Actions
- Actions
- Actions
- Actions
- Actions
- Actions
- Actions
- Actions
- Actions
- Actions
- Actions
- Actions
- Actions
- Actions
- Actions
- Actions
- Actions
- Actions
- Actions
- Actions
- Actions
- Actions
- Actions
- Actions
- Actions
- Actions
- Actions
- Actions
- Actions
- Actions
- Actions
- Actions
- Actions
- Actions
- Actions
- Actions
- Actions
- Actions
- Actions
- Actions
- Actions
- Actions
- Actions
- Actions
- Actions
- Actions
- Actions
- Actions
- Actions
- Actions
- Actions
- Actions
- Actions
- Actions
- Actions
- Actions
- Actions
- Actions
- Actions
- Actions
- Actions
- Actions
- Actions
- Actions
- Actions
- Actions
- Actions
- Actions
- Actions
- Actions
- Actions
- Actions
- Actions
- Actions
- Actions
- Actions
- Actions
- Actions
- Actions
- Actions
- Actions
- Actions
- Actions
- Actions
- Actions
- Actions
- Actions
- Actions
- Actions
- Actions
- Actions
- Actions
- Actions
- Actions
- Actions
- Actions
- Actions
- Actions
- Actions
- Actions
- Actions
- Actions
- Actions
- Actions
- Actions
- Actions
- Actions
- Actions
- Actions
- Actions
- Actions
- Actions
- Actions
- Actions
- Actions
- Actions
- Actions
- Actions
- Actions
- Actions
- Actions
- Actions
- Actions
- Actions
- Actions
- Actions
- Actions
- Actions
- Actions
- Actions
- Actions
- Actions
LinkOut - more resources
Full Text Sources
Molecular Biology Databases
