. 2009 Jun;150(2):1083-92.
doi: 10.1104/pp.109.135509. Epub 2009 Apr 10.

Phytochrome B enhances photosynthesis at the expense of water-use efficiency in Arabidopsis

Affiliations

Phytochrome B enhances photosynthesis at the expense of water-use efficiency in Arabidopsis

Hernán E Boccalandro et al. Plant Physiol. 2009 Jun.

Abstract

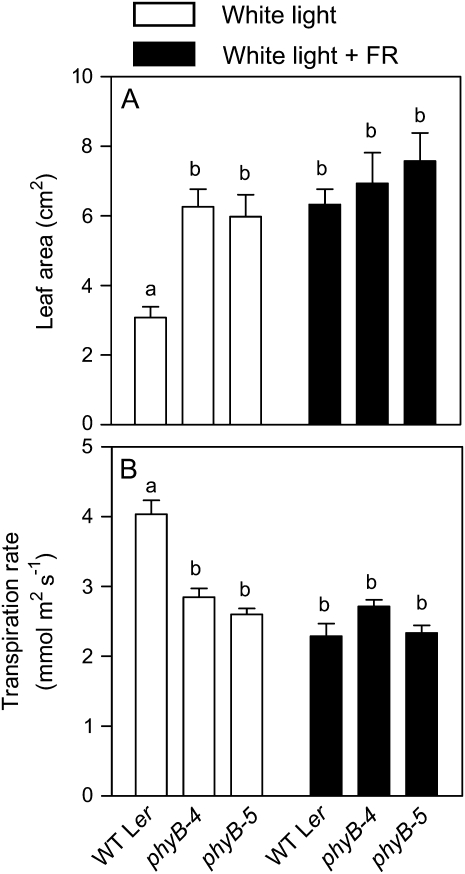
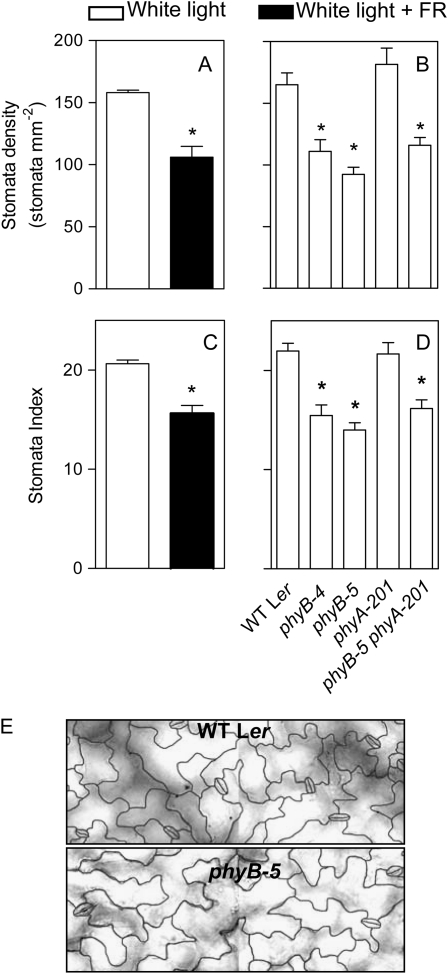
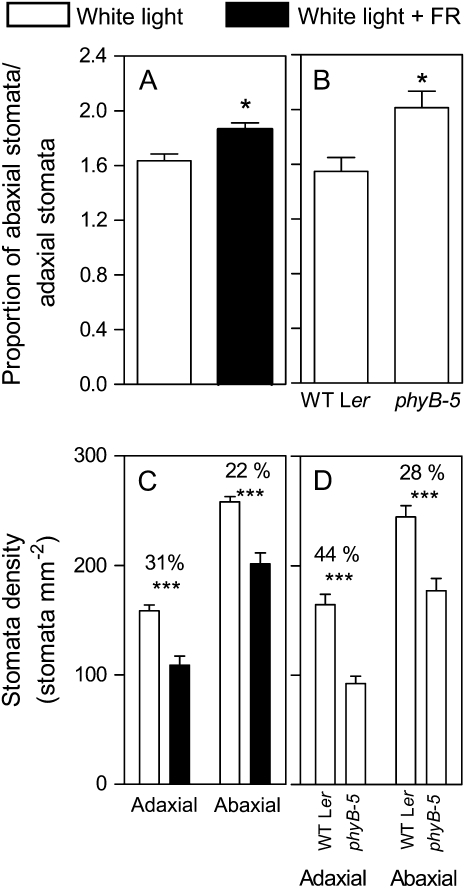
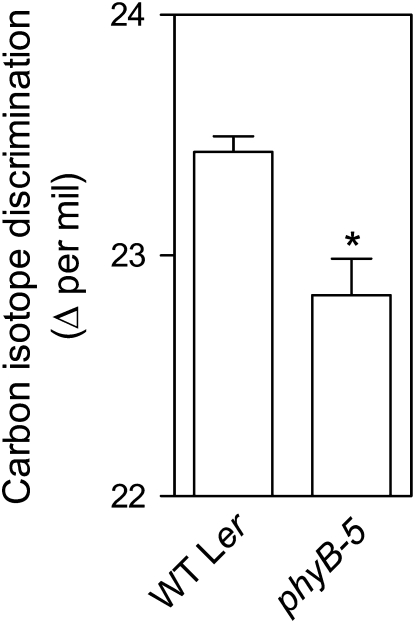
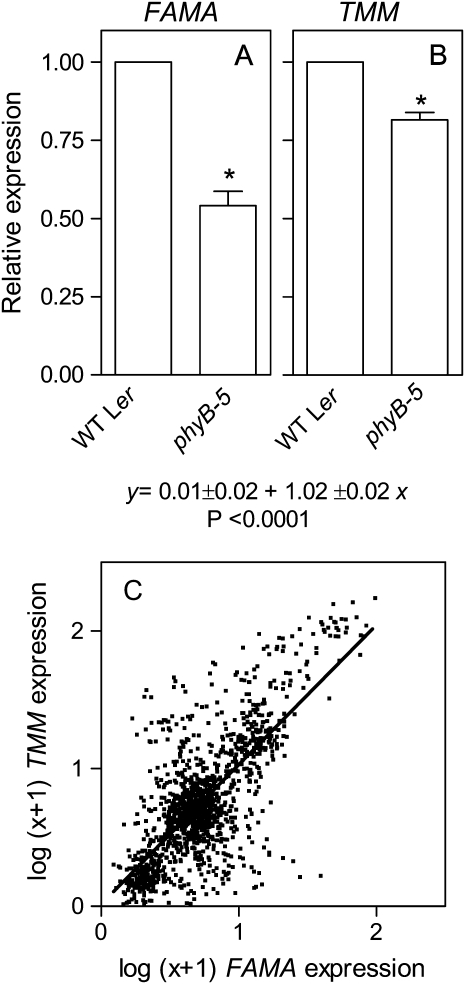
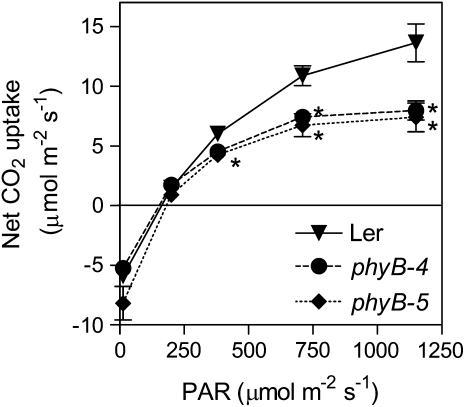
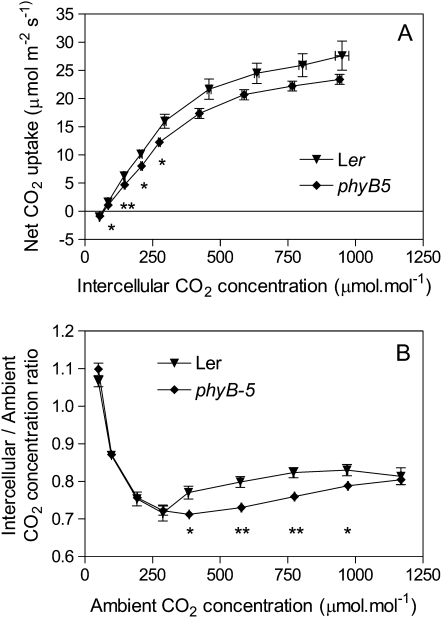
In open places, plants are exposed to higher fluence rates of photosynthetically active radiation and to higher red to far-red ratios than under the shade of neighbor plants. High fluence rates are known to increase stomata density. Here we show that high, compared to low, red to far-red ratios also increase stomata density in Arabidopsis (Arabidopsis thaliana). High red to far-red ratios increase the proportion of phytochrome B (phyB) in its active form and the phyB mutant exhibited a constitutively low stomata density. phyB increased the stomata index (the ratio between stomata and epidermal cells number) and the level of anphistomy (by increasing stomata density more intensively in the adaxial than in the abaxial face). phyB promoted the expression of FAMA and TOO MANY MOUTHS genes involved in the regulation of stomata development in young leaves. Increased stomata density resulted in increased transpiration per unit leaf area. However, phyB promoted photosynthesis rates only at high fluence rates of photosynthetically active radiation. In accordance to these observations, phyB reduced long-term water-use efficiency estimated by the analysis of isotopic discrimination against (13)CO(2). We propose a model where active phyB promotes stomata differentiation in open places, allowing plants to take advantage of the higher irradiances at the expense of a reduction of water-use efficiency, which is compensated by a reduced leaf area.


Figures

Figure 1.
Figure 1.
Phytochrome controls leaf transpiration rate. Leaf area per plant (A) and transpiration per unit leaf area (B) in seedlings of the wild type and of the phyB mutants grown under white light with or without exposure to FR at the end of the photoperiod. Data are means and se of at least 21 plant replicates. Factorial ANOVA indicates significant interaction (P < 0.0001) between the effects of the phyB mutations and the +FR treatment because the phyB mutation had effects under white light but not under white light + FR (A and B). Different letters denote significant differences (P < 0.05) among means according to Bonferroni post tests.
Figure 2.
Figure 2.
Phytochrome controls stomata density (A and B) and stomata index (C and D). Plants of the wild type were grown under white light and white light + FR (A and C) and plants of the phyA, phyB, and phyA phyB mutants (B and D) were grown with their respective wild type under white light. Data are means and se of at least 12 plant replicates. Asterisk (*) denotes significant differences (P < 0.05) between the indicated condition or genotype and its control according to ANOVA followed by Bonferroni post tests. E, Representative sections of the epidermis are shown for a phyB mutant and its wild type (WT Ler). Stomata density, index, and images correspond to the adaxial epidermis of fully expanded leaves.
Figure 3.
Figure 3.
Phytochrome increases the level of amphistomy (A and B). The abaxial and abaxial stomatal densities and the percent decrease caused by +FR or by the phyB mutation are also shown (C and D). Plants of the wild type were grown under white light and white light + FR (A and C) and plants of the phyB mutant were grown with its wild type under white light (B and D). Data are means and se of at least 12 plant replicates. Asterisk (*) denotes significant differences (P < 0.05) according to ANOVA. *** denotes significant differences (P < 0.001) according to Bonferroni post tests.
Figure 4.
Figure 4.
Phytochrome reduces water-use efficiency. Plants of the phyB mutant and its wild type were grown under white light. Data are means and se of three plant replicates (pool of three plants each one). Asterisk (*) denotes significant differences (P < 0.05) according to ANOVA.
Figure 5.
Figure 5.
Phytochrome promotes the expression of FAMA and TMM in the leaves and the positive correlation in the expression of these two genes extends beyond phyB action. A and B, Plants of the phyB mutant and its wild type were grown under white light. Data are means and se of three biological replicates. Asterisk (*) denotes significant differences (P < 0.05) according to ANOVA. C, Positive correlation between the expression of FAMA and TMM. The figure includes 633 data points corresponding to different developmental contexts and biotic or abiotic treatments (1–3 biological replicates per point) taken from 46 experiments (1,388 microarrays; www.arabidopsis.org). Data were normalized to the median of each experiment and transformed as ln (x + 1) (Buchovsky et al., 2008). The line shows least square linear fit of the 633 points and the significance is indicated.
Figure 6.
Figure 6.
Phytochrome promotes photosynthesis in Arabidopsis. Plants of the wild type and of the phyB mutants were grown under white light and then exposed to the indicated PAR during measurements. Data are means and se of six plant replicates. Asterisk (*) denotes significant differences (P < 0.05) according to ANOVA and Bonferroni post tests.
Figure 7.
Figure 7.
Analysis of stomatic and nonstomatic limitations to photosynthesis. A, Curves of leaf net CO2 uptake against intercellular CO2 concentrations were obtained with a LI-COR 6400 system for the wild type and the phyB-5 mutant. B, Ratio between intercellular and ambient CO2 concentrations plotted against ambient CO2 concentration (i.e. the concentration in the sample infrared gas analyzer of the LI-COR 6400 system). Data are means and se of five plant replicates. Asterisk (*) denotes significant differences (P < 0.05) according to t tests. The tests were done between wild type and the phyB having the closest intercellular (A) or ambient (B) CO2 concentrations (in A, this overestimates the significance of the difference for the samples around 280 μmol mol−1).

Similar articles

Cited by

References

    1. Aphalo PJ, Gibson D, Di Benedetto AH (1991) Responses of growth, photosynthesis, and leaf conductance to white light irradiance and end-of-day red and far-red pulses in Fuchsia magellanica Lam. New Phytol 117 461–471 - PubMed
    1. Assmann SM (1992) Effects of light quantity and quality during development on the morphology and stomatal physiology of Commelina communis. Oecologia 92 188–195 - PubMed
    1. Ballaré CL, Sánchez RA, Scopel AL, Casal JJ, Ghersa CM (1987) Early detection of neighbour plants by phytochrome perception of spectral changes in reflected sunlight. Plant Cell Environ 10 551–557
    1. Baroli I, Dean Price G, Badger M, von Caemmerer S (2008) The contribution of photosynthesis to the red light response of stomatal conductance. Plant Physiol 146 737–747 - PMC - PubMed
    1. Boccalandro HE, Ploschuk EL, Yanovsky MJ, Sanchez RA, Gatz C, Casal JJ (2003) Increased phytochrome B alleviates density effects on tuber yield of field potato crops. Plant Physiol 133 1539–1546 - PMC - PubMed

Publication types

MeSH terms