

Review
doi: 10.1097/RMR.0b013e318181e0be.
Research applications of magnetic resonance spectroscopy to investigate psychiatric disorders
Affiliations
- PMID: 19363431
- PMCID: PMC2669689
- DOI: 10.1097/RMR.0b013e318181e0be
Item in Clipboard
Review
Research applications of magnetic resonance spectroscopy to investigate psychiatric disorders
Top Magn Reson Imaging.
2008 Apr.
Abstract
Advances in magnetic resonance spectroscopy (MRS) methodology and related analytic strategies allow sophisticated testing of neurobiological models of disease pathology in psychiatric disorders. An overview of principles underlying MRS, methodological considerations, and investigative approaches is presented. A review of recent research is presented that highlights innovative approaches applying MRS, in particular, hydrogen MRS, to systematically investigate specific psychiatric disorders, including autism spectrum disorders, schizophrenia, panic disorder, major depression, and bipolar disorder.
Figures
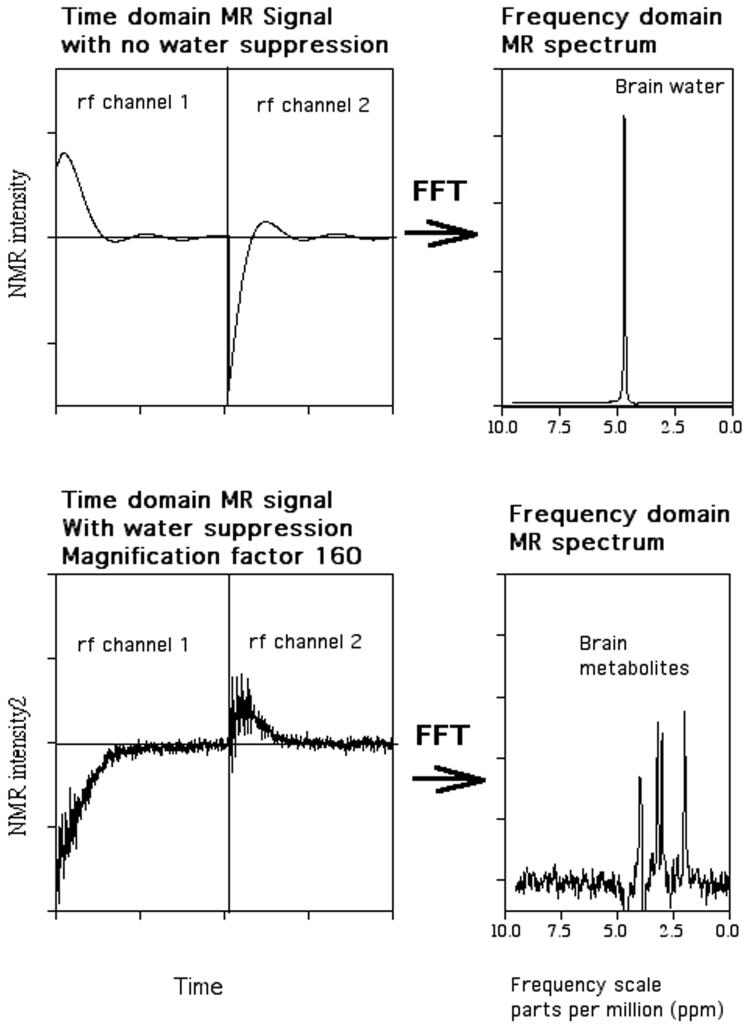
Time domain free induction decay (left-hand side) and frequency domain Fourier transform (right-hand side) of brain 1H MRS signal. The top and bottom panels demonstrate spectra without and with water suppression, respectively.
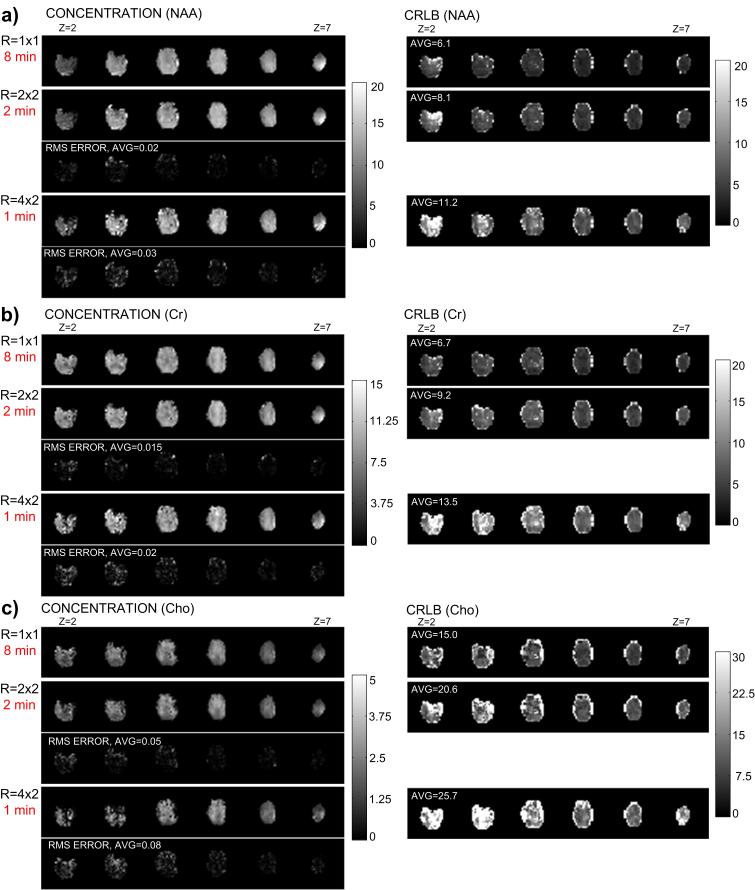
3-D spatial chemical concentration maps at different acquisition times (using SENSE acceleration to reduce the number of phase-encoding steps) are shown on the left-hand side, with corresponding spectral fitting error maps (RMS-ERROR) calculated in comparison to the non-accelerated reconstruction (R=1×1) acquired at 8 minutes for a) NAA, b) Creatine and c) Choline. Cramer-Rao lower bound (CRLB) is shown on the right-hand side for each chemical concentration map. CRLB is the error term resulting from spectral fitting to the LC apriori model used to determine chemical concentration. (Figure provided by Dr. Ricardo Otazo)
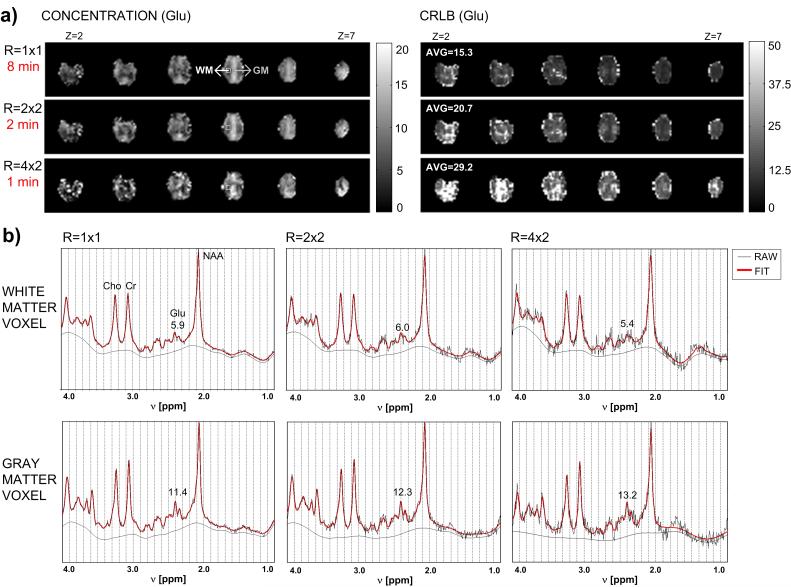
a) 3-D spatial chemical concentration maps and Cramer-Rao lower bound (CRLB) maps for Glutamate (Glu) at different acquisition times using SENSE to reduce the number of phase-encoding steps. CRLB is the error term resulting from spectral fitting to the LC apriori model used to determine chemical concentration. b) Raw absorption mode spectrum (black line) and corresponding LCModel fit (red line) for a gray matter (GM) voxel and a white matter (WM) voxel (voxel locations are indicated in part a). The remaining baseline is given by the smooth black curve. The concentration of Glutamate is given in each example. (Figure provided by Dr. Ricardo Otazo)
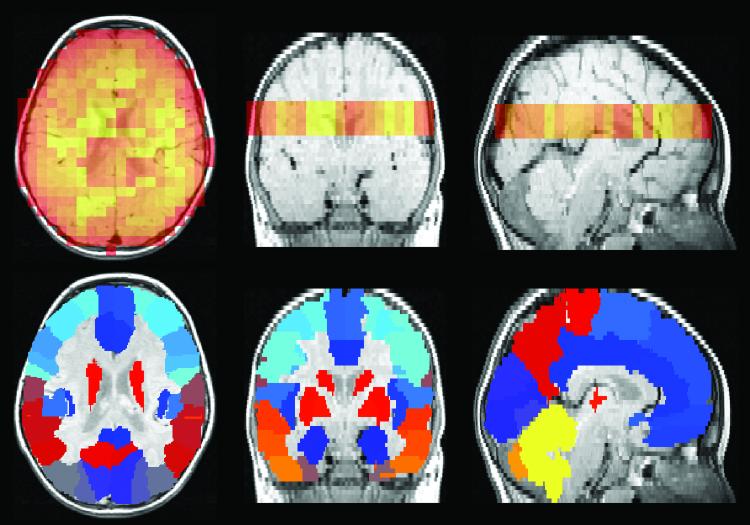
Proton echo-planar spectroscopic image (PEPSI) NAA spatial distribution map shown in orange (top panel) and corresponding anatomical atlas (bottom panel) both of which are overlaid onto a MRI structural image. Each color in the atlas represents a different brain region (http://www.sph.sc.edu/comd/rorden/mricro.html ).
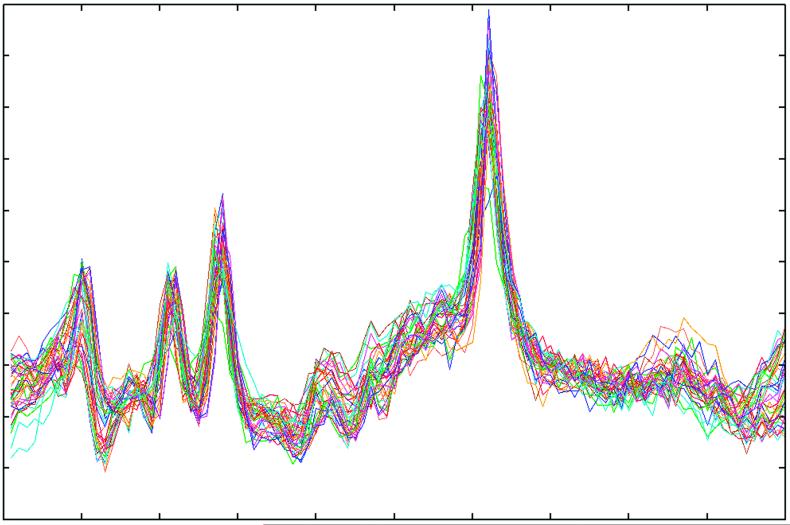
Superimposed individual raw spectral acquisitions from the left frontal lobe, after filtering out spectra with artifact. These spectra are then averaged to obtain a single spectrum for this brain region.
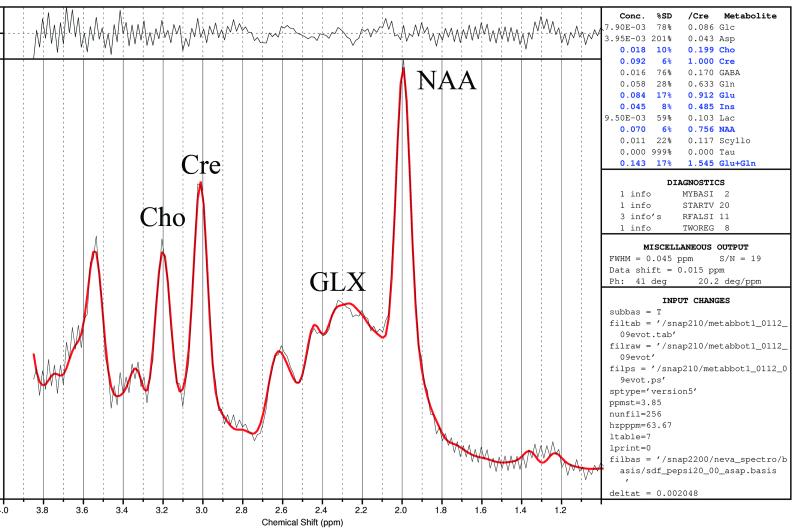
LC Model fit of averaged spectra acquired from the left frontal lobe. Black line: averaged spectrum. Red line: the LC Model fit. The residuals, calculated as a subtraction of the fit from the average spectrum, are plotted at the top. The table of metabolite concentrations calculated from the fit is to the right.
Similar articles
-
Magnetic resonance spectroscopy: current and future applications in psychiatric research.Biol Psychiatry. 2002 Feb 1;51(3):195-207. doi: 10.1016/s0006-3223(01)01313-0. Biol Psychiatry. 2002. PMID: 11839362 Review.
-
Magnetic Resonance Spectroscopy for Psychiatry: Progress in the Last Decade.Neuroimaging Clin N Am. 2020 Feb;30(1):25-33. doi: 10.1016/j.nic.2019.09.002. Epub 2019 Nov 8. Neuroimaging Clin N Am. 2020. PMID: 31759569 Review.
-
Use of proton magnetic resonance spectroscopy in the treatment of psychiatric disorders: a critical update.Dialogues Clin Neurosci. 2013 Sep;15(3):329-37. doi: 10.31887/DCNS.2013.15.3/jbustillo. Dialogues Clin Neurosci. 2013. PMID: 24174904 Free PMC article. Review.
-
Magnetic resonance spectroscopy in psychiatry: basic principles and applications.Br Med Bull. 1996 Jul;52(3):474-85. doi: 10.1093/oxfordjournals.bmb.a011561. Br Med Bull. 1996. PMID: 8949251 Review.
-
Perfusion magnetic resonance imaging in psychiatry.Top Magn Reson Imaging. 2008 Apr;19(2):111-30. doi: 10.1097/RMR.0b013e3181808140. Top Magn Reson Imaging. 2008. PMID: 19363433 Review.
Cited by
-
Neurochemical abnormalities in unmedicated bipolar depression and mania: a 2D 1H MRS investigation.Psychiatry Res. 2013 Sep 30;213(3):235-41. doi: 10.1016/j.pscychresns.2013.02.008. Epub 2013 Jun 27. Psychiatry Res. 2013. PMID: 23810639 Free PMC article.
-
Neurometabolites in schizophrenia and bipolar disorder - a systematic review and meta-analysis.Psychiatry Res. 2012 Aug-Sep;203(2-3):111-25. doi: 10.1016/j.pscychresns.2012.02.003. Epub 2012 Sep 13. Psychiatry Res. 2012. PMID: 22981426 Free PMC article.
-
Attention-deficit/hyperactivity disorder and brain metabolites from proton magnetic resonance spectroscopy: a systematic review and meta-analysis protocol.Trends Psychiatry Psychother. 2021 Jan-Mar;43(1):1-8. doi: 10.47626/2237-6089-2019-0111. Trends Psychiatry Psychother. 2021. PMID: 33681905 Free PMC article.
-
Decreased frontal lobe function in people with Internet addiction disorder.Neural Regen Res. 2013 Dec 5;8(34):3225-32. doi: 10.3969/j.issn.1673-5374.2013.34.006. Neural Regen Res. 2013. PMID: 25206643 Free PMC article.
-
Adults with attention-deficit/hyperactivity disorder - a brain magnetic resonance spectroscopy study.Front Psychiatry. 2011 Nov 23;2:65. doi: 10.3389/fpsyt.2011.00065. eCollection 2011. Front Psychiatry. 2011. PMID: 22131979 Free PMC article.
References
-
- Andreasen NC. Brain imaging: applications in psychiatry. Science. 1988;239:1381–1388. - PubMed
-
- Ross B, Michaelis T. Clinical applications of magnetic resonance spectroscopy. Magn Reson Med. 1994;10:191–247. - PubMed
-
- Rapaport S. Blood-Brain Barrier in Physiology and Medicine. Raven Press; New York: 1976.
-
- Lauterbur PC. Image formation by induced local interactions: examples employing nuclear magnetic resonance. Nature. 1973;242:190–191. - PubMed
-
- Mansfield P, Grannell PK. NMR diffraction in solids? J Phys C: Solid State Phys. 1973;6:422–426.
Publication types
MeSH terms
Substances
Grants and funding
LinkOut - more resources
Full Text Sources
Other Literature Sources
Medical
