. 2009 May 21;459(7245):428-32.
doi: 10.1038/nature08012. Epub 2009 Apr 12.

Non-genetic origins of cell-to-cell variability in TRAIL-induced apoptosis

Affiliations

Non-genetic origins of cell-to-cell variability in TRAIL-induced apoptosis

Sabrina L Spencer et al. Nature. .

Abstract

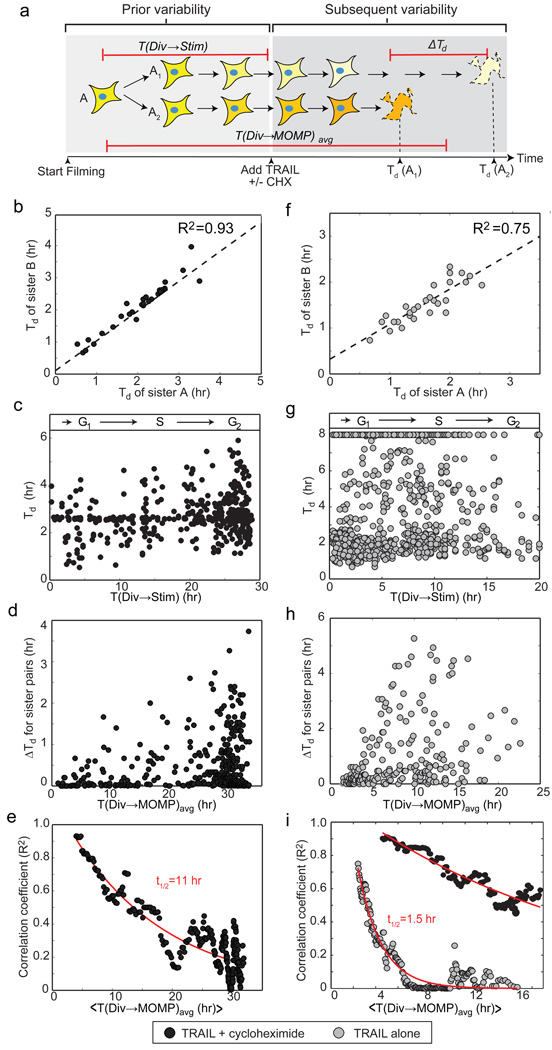
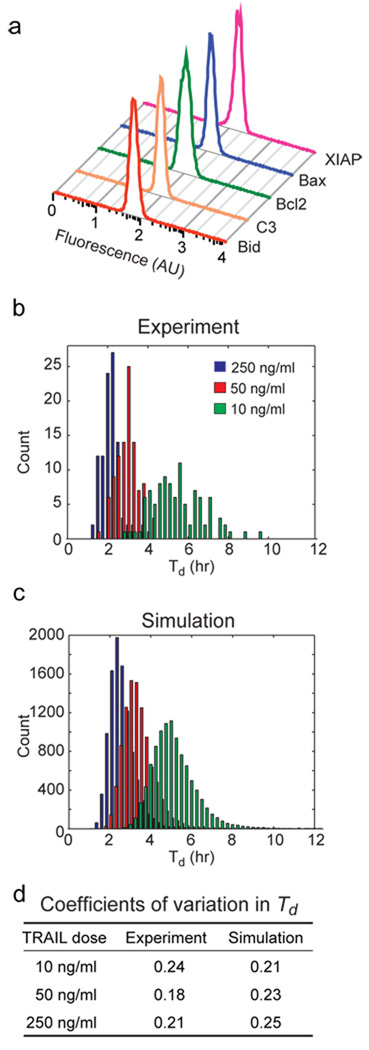
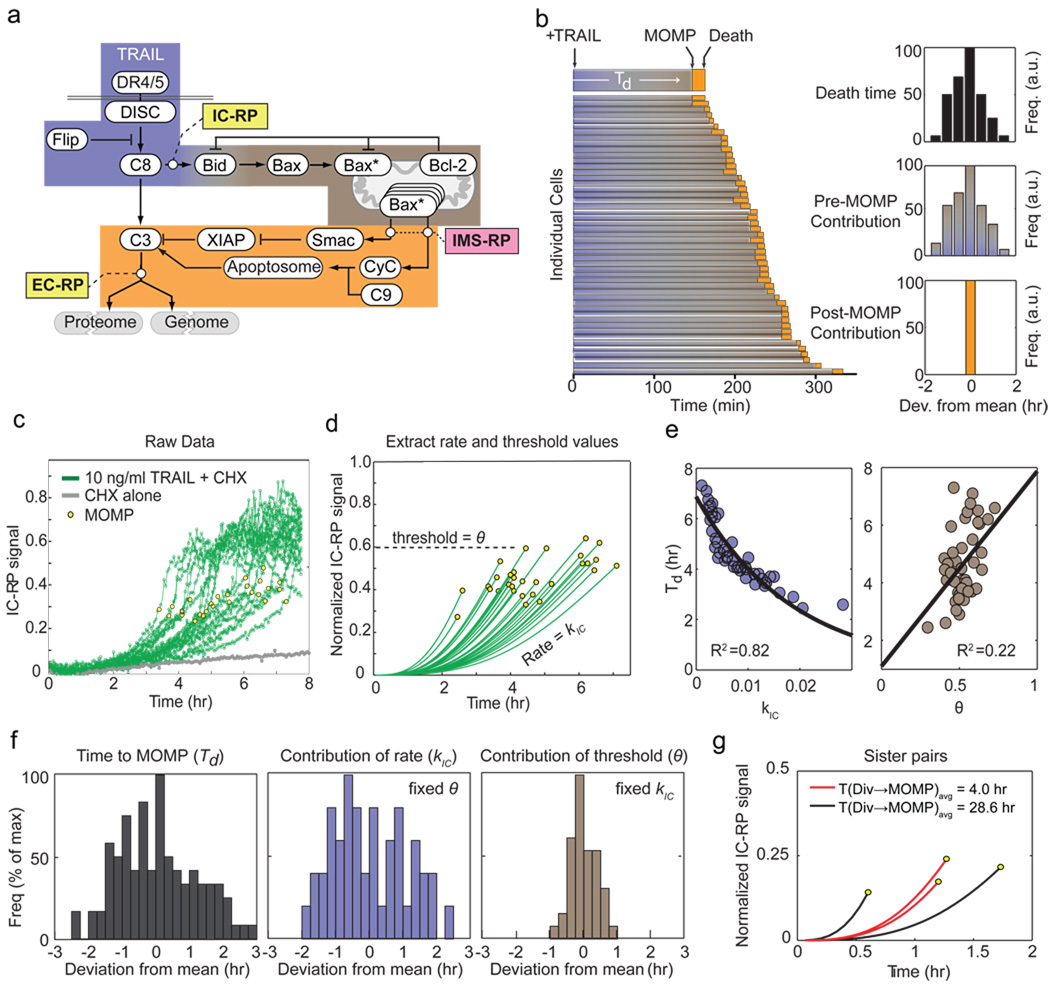
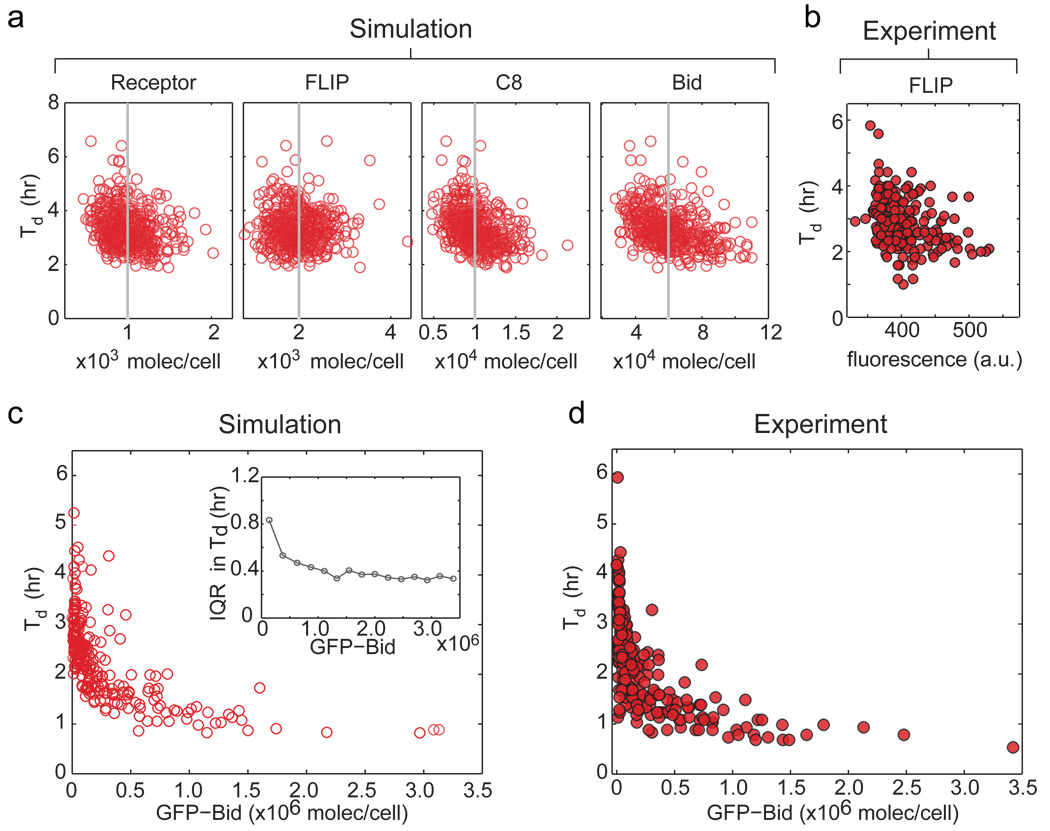
In microorganisms, noise in gene expression gives rise to cell-to-cell variability in protein concentrations. In mammalian cells, protein levels also vary and individual cells differ widely in their responsiveness to uniform physiological stimuli. In the case of apoptosis mediated by TRAIL (tumour necrosis factor (TNF)-related apoptosis-inducing ligand) it is common for some cells in a clonal population to die while others survive-a striking divergence in cell fate. Among cells that die, the time between TRAIL exposure and caspase activation is highly variable. Here we image sister cells expressing reporters of caspase activation and mitochondrial outer membrane permeabilization after exposure to TRAIL. We show that naturally occurring differences in the levels or states of proteins regulating receptor-mediated apoptosis are the primary causes of cell-to-cell variability in the timing and probability of death in human cell lines. Protein state is transmitted from mother to daughter, giving rise to transient heritability in fate, but protein synthesis promotes rapid divergence so that sister cells soon become no more similar to each other than pairs of cells chosen at random. Our results have implications for understanding 'fractional killing' of tumour cells after exposure to chemotherapy, and for variability in mammalian signal transduction in general.


Figures

Figure 1
Figure 1. Time-to-death is highly correlated between HeLa sister cells but correlation decays as a function of time since division
a, Schematic of experimental design. ΔTd represents the difference in time of MOMP between sisters; T(DivMOMP)avg the time between cytokinesis of the mother and the average time of MOMP in daughter cells; T(DivStim) the time between cytokinesis and TRAIL addition. The shading of each cell depicts concentrations/states of relevant proteins. b and f, Similarity in Td among pairs of recently divided sister cells (T(DivMOMP)avg < 7 hr for (b) and <3.5 hr for (f)). c and g, Td as a function of T(DivStim), a proxy for cell cycle state (R2 < 0.03). d and h, ΔTd as a function of T(DivMOMPavg. e and i, Decay in the correlation of Td between sister pairs as a function of T(DivMOMP)avg. In (i), black circles represent data for cells treated with TRAIL plus cycloheximide imaged in parallel with the TRAIL alone treatment (Supplementary Fig. 5).
Figure 2
Figure 2. Endogenous variation in the concentrations of apoptotic regulators is sufficient to explain variability in Td
a, Protein distributions in untreated HeLa cells determined by flow cytometry. b and c, Distributions of Td for HeLa cells treated with TRAIL at concentrations indicated (with cyloheximide) as determined experimentally (b) or estimated by simulations (c). d, Coefficients of variation for distributions in (b) and (c).
Figure 3
Figure 3. A single time-dependent process upstream of MOMP predicts time-to-death
a, Schematic of receptor-mediated apoptosis signalling with IC-RP, EC-RP, and IMS-RP indicated. The Bcl-2 protein family is represented in simplified form by Bid, Bax, and Bcl-2. Reactions occur before (blue), during (grey), or subsequent to MOMP (orange). b, Timing of apoptotic events in HeLa cells expressing IMS-RP and EC-RP and treated with TRAIL; blue-grey denotes the pre-MOMP interval and orange the interval between MOMP and half-maximal cleavage of EC-RP (a marker of death). Insets show death times computed from data (top) and contributions of pre-MOMP (middle) or post-MOMP (top) intervals. c and d, Raw and fitted trajectories for IC-RP cleavage in single TRAIL-treated HeLa cells co-expressing IMS-RP and IC-RP. Values for height of the MOMP threshold (θ) and rate of approach to the threshold (kIC) were derived by fitting (Supplementary Fig. 6). e, Correlation between Td and kIC (left) or θ (right) for data in (d). f, Relative contributions of variability in kIC (blue) or θ (grey) to variability in Td (black; Supplementary Fig. 7). g, Trajectories of IC-RP cleavage in recently divided sister HeLa cells having similar Td (red) and older sisters with differing Td (black) treated with 50 ng/ml TRAIL.
Figure 4
Figure 4. No single protein predicts Td under normal conditions but over-expression can increase predictability
a, Td as a function of four protein levels based on simulation. Grey lines denote mean protein concentration; each point represents a single simulated cell. b, Death time as a function of endogenous FLIP levels in H1299 cells. c and d, Effect of GFP-Bid over-expression on Td in HeLa cells, as predicted by simulation (c) or observed in experiment (d). Inset shows reduction in dispersion of Td with increasing Bid, as measured by interquartile range (IQR; Supplementary Fig. 8).

Comment in

References

    1. Blake WJ, AErn M K, Cantor CR, et al. Nature. 2003;422(6932):633. - PubMed
    1. Colman-Lerner A, Gordon A, Serra E, et al. Nature. 2005;437(7059):699. - PubMed
    1. Elowitz MB, Levine AJ, Siggia ED, et al. Science (New York, N.Y. 2002;297(5584):1183. - PubMed
    1. Golding I, Paulsson J, Zawilski SM, et al. Cell. 2005;123(6):1025. - PubMed
    1. McAdams HH, Arkin A. Proceedings of the National Academy of Sciences of the United States of America. 1997;94(3):814. - PMC - PubMed

Publication types

Substances