. 2009 May;12(5):585-92.
doi: 10.1038/nn.2302. Epub 2009 Apr 12.

BK channels modulate pre- and postsynaptic signaling at reciprocal synapses in retina

Affiliations

BK channels modulate pre- and postsynaptic signaling at reciprocal synapses in retina

William N Grimes et al. Nat Neurosci. 2009 May.

Abstract

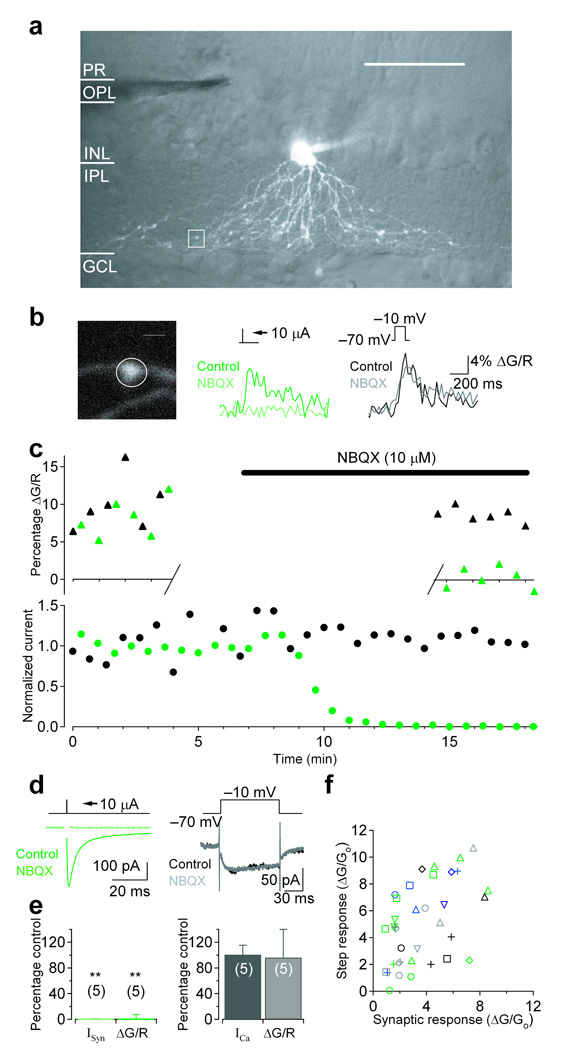
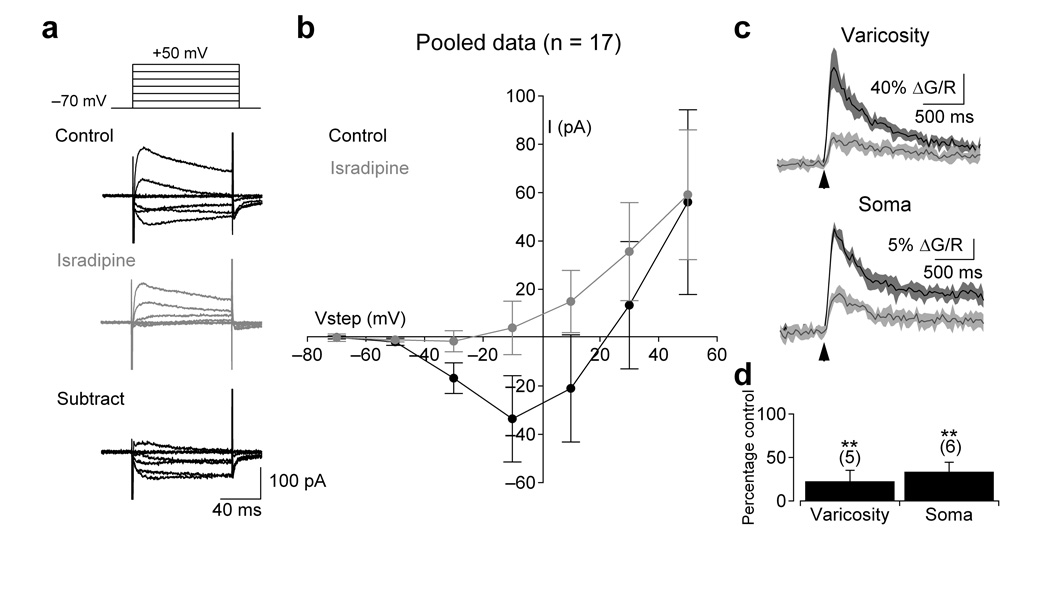
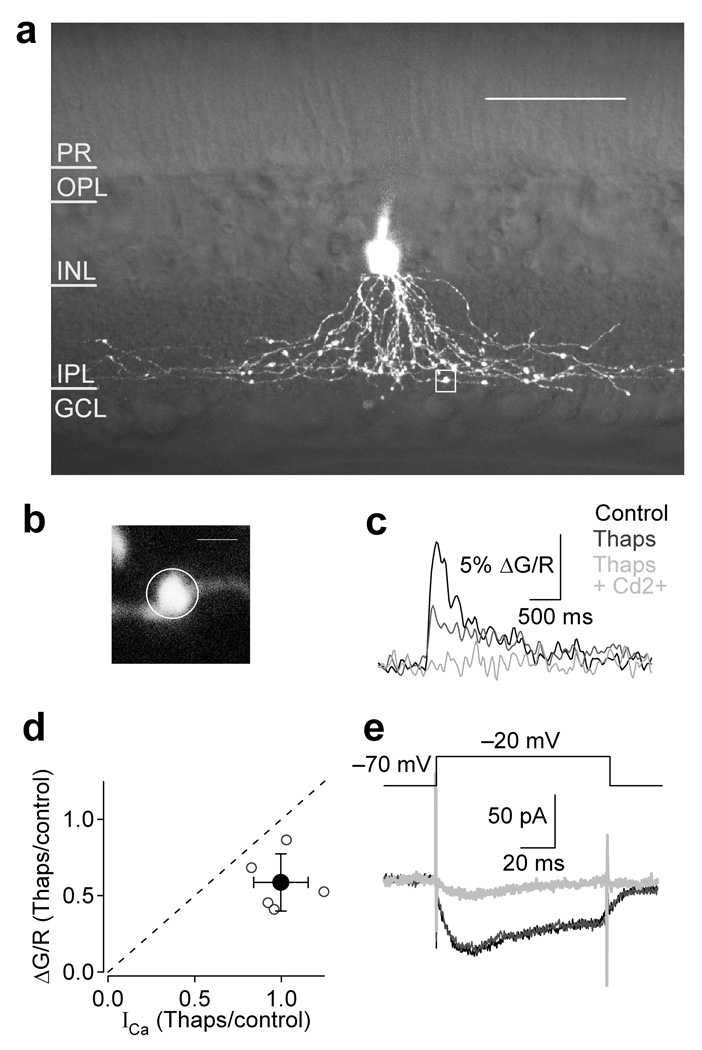
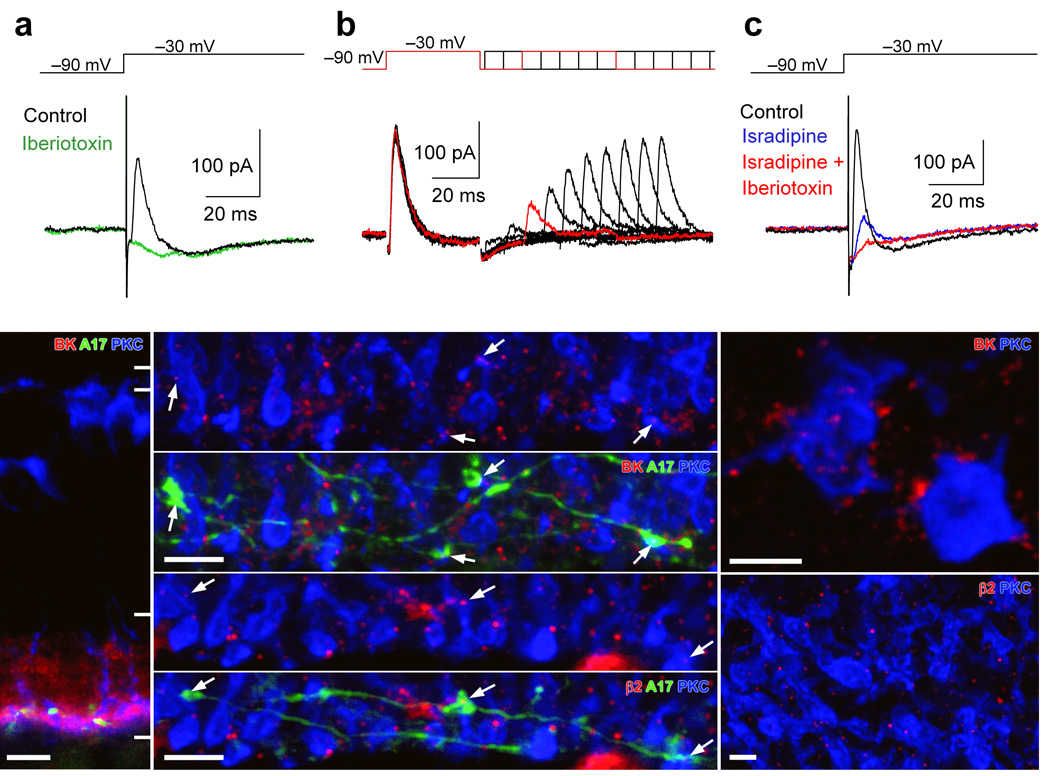
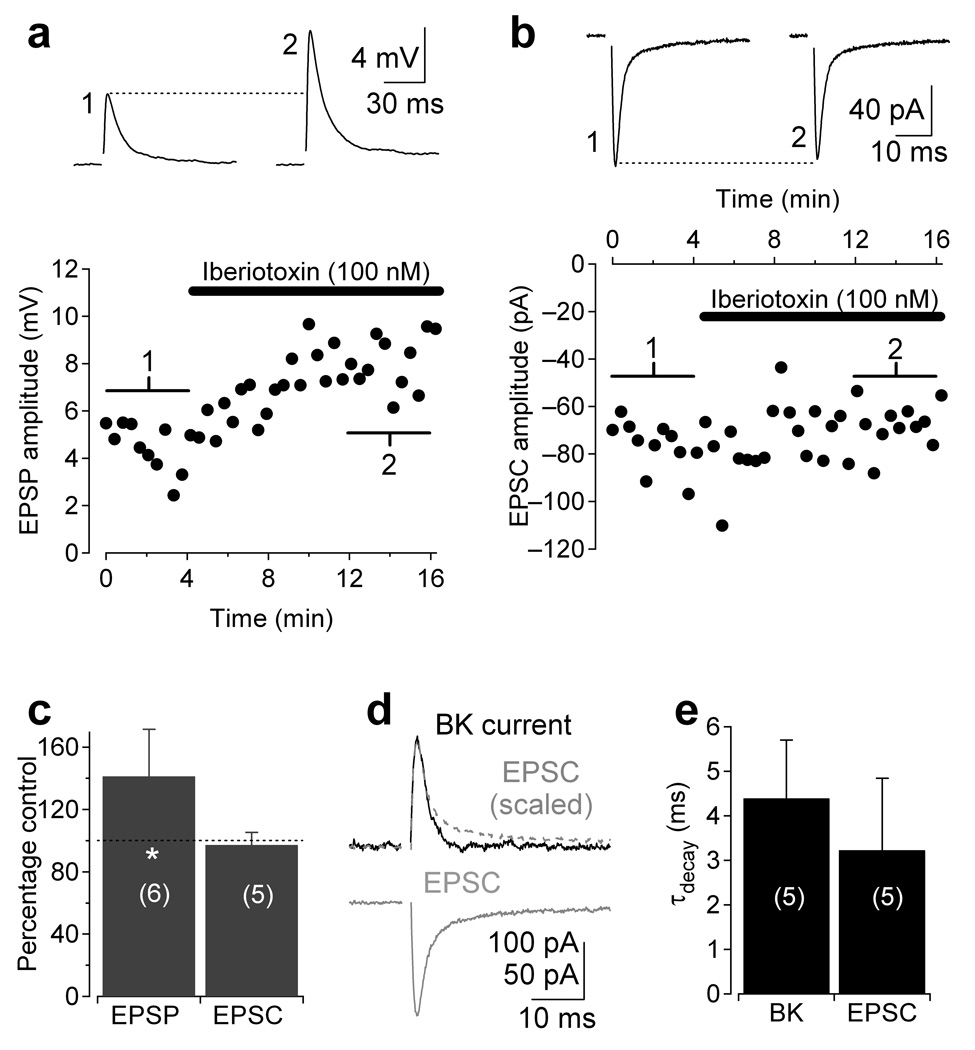
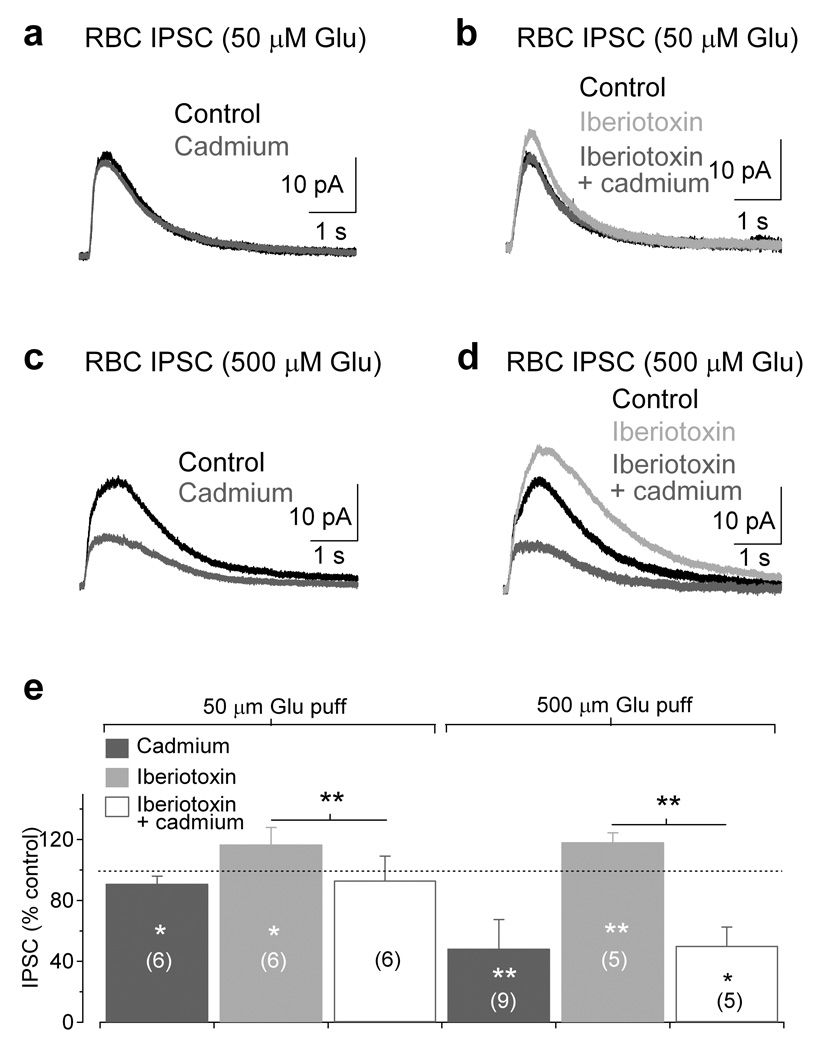
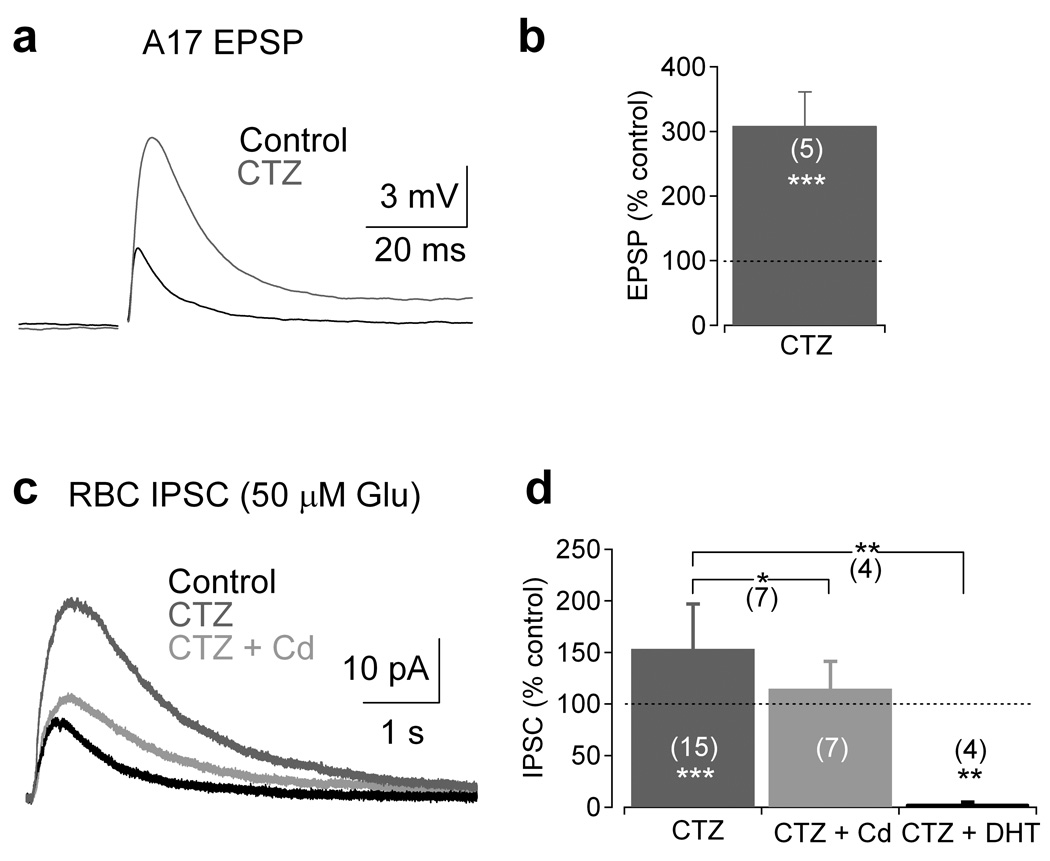
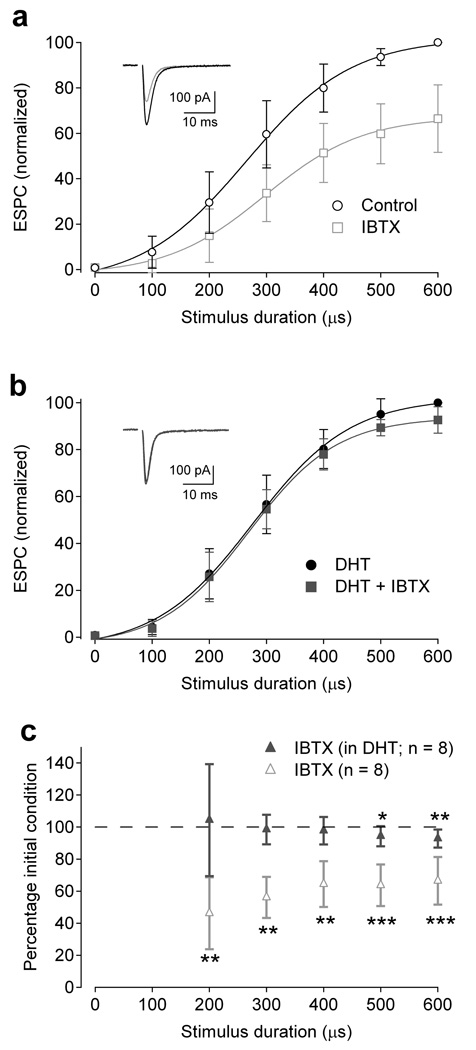
In the mammalian retina, A17 amacrine cells provide reciprocal inhibitory feedback to rod bipolar cells, thereby shaping the time course of visual signaling in vivo. Previous results have indicated that A17 feedback can be triggered by Ca(2+) influx through Ca(2+)-permeable AMPA receptors and can occur independently of voltage-gated Ca(2+) (Ca(v)) channels, whose presence and functional role in A17 dendrites have not yet been explored. We combined electrophysiology, calcium imaging and immunohistochemistry and found that L-type Ca(v) channels in rat A17 amacrine cells were located at the sites of reciprocal synaptic feedback and that their contribution to GABA release was diminished by large-conductance Ca(2+)-activated potassium (BK) channels, which suppress postsynaptic depolarization in A17s and limit Ca(v) channel activation. We also found that BK channels, by limiting GABA release from A17s, regulate the flow of excitatory synaptic transmission through the rod pathway.


Figures

Figure 1
Figure 1
Voltage-gated calcium channels are colocalized with synaptic inputs at individual A17 varicosities. (ad) Single cell experiment. (a) 3D 2-photon reconstruction of an A17 amacrine cell superimposed on a single IR-DIC image of the retinal slice. Scale bar = 50 µm. (b) Single varicosity (left) calcium transients were observed in response to synaptic stimulation (center; green) or voltage step (right; black; −70 mV to −10 mV; 100 ms). Scale bar = 2 µm. (c) Fluorescence (top) and current (bottom) amplitudes plotted over time in response to interleaved stimulation (green: synaptic, black: voltage step). Application of NBQX (10 µM) completely blocked synaptic currents and fluorescence. Single varicosity calcium fluorescence was observed for the first 12 responses (control) and for a subsequent 12 responses (NBQX) approximately 8 minutes after the onset of NBQX application to minimize photodamage. (d) Synaptic and voltage-dependent currents. (e) Summary of pharmacological effects on synaptically evoked (left) and step evoked (right) currents and fluorescence (n = 5 cells). Bar graphs indicate mean ± SD. (f) Varicosities exhibiting fluorescent responses to synaptic stimulation also responded to a single voltage step (35 of 36 varicosities; n = 2 cells; multiple varicosities from the same cell are indicated by identically colored/shaped symbols).
Figure 2
Figure 2
Functional L-type VGCCs are expressed at A17 synaptic varicosities and somata. (a) A series of depolarizing voltage steps (−70 to +50 mV in 20 mV increments; 100 ms) elicited an isradipine (10 µM)- sensitive inward current. (b) Summary of the current-voltage relationship in control and in the presence of isradipine (10 µM; n = 17 cells). (c) Depolarizing voltage steps (100 ms to −10 mV) also elicited isradipine-sensitive fluorescence transients in the varicosities (top) and somas (bottom) of A17 amacrine cells. Fluorescence from a single varicosity (typically a 16×16 frame) was acquired at ~50 Hz and a small region of interest (as in Fig. 1b) was drawn around the varicosity to produce an average pixel value. Traces are the average of eight responses to 100 ms voltage steps before and after isradipine application (arrows indicate onset of step). Shaded regions indicate ± SD. (d) Summary of the effects of isradipine on voltage-dependent fluorescence at individual varicosities (n = 5 cells) and somas (n = 6 cells). Data in panels b and d represent mean ± SD.
Figure 3
Figure 3
Intracellular stores amplify voltage-dependent calcium responses in varicosities. (a–c, e) Single cell experiment. (a) 3D 2-photon reconstruction of an A17 amacrine cell superimposed on a single IR-DIC image of the retinal slice. Scale bar = 50 µm. (c) Fluorescence trace was derived from the indicated ROI (b, white box in a) in control (black), thapsigargin (1 µM; gray), and thapsigargin plus Cd2+ (200 µM; light gray). Scale bar = 2 µm. (d) Summary of the effects of thapsigargin on current and fluorescence amplitudes for 5 cells. Bar graph indicates mean ± SD. (e) Ca2+ current in control (black), thapsigargin (gray), and thapsigargin plus Cd2+ (light gray). Imposed electrode potential (−70 to −20 mV; 100 ms).
Figure 4
Figure 4
A17s varicosities express rapidly inactivating BK channels that are functionally coupled to L-type VGCCs. (a) Depolarizing voltage steps (from −90 to −30mV; 100ms) in an A17 elicited a rapidly inactivating outward current (with potassium-based internal solution) that was blocked by iberiotoxin (100 nM) (b) Paired depolarizing steps delivered at varying intervals revealed the time course of recovery from inactivation. (c) The transient outward current also was blocked by the L-type VGCC blocker, isradipine (10 µM). (d) Immunohistochemical techniques reveal BK (red) channel expression throughout the inner plexiform layer of a slice. Anti-PKCα was used to label RBCs (blue) and the dendrites of a single A17 were filled with neurobiotin (green) through the patch pipette. Scale bar = 10 µm. (e,f) A higher-magnification view of sublamina 5 in the IPL indicates that BK (e) and β2 subunit (f) puncta are localized to A17 varicosities that are adjacent to RBC terminals. Scale bars = 5 µm. (g,h) Antibody staining for PKC (blue) and BK (red, g) or β2 (red, h) in whole-mount retina illustrates the clustering of channels antibody around RBC terminals. Scale bars = 2 µm.
Figure 5
Figure 5
BK channels suppress synaptic transmission. (a) Synaptic stimulation of current-clamped A17 elicited EPSPs which were potentiated by application of iberiotoxin (black bar, 100 nM). (b) EPSCs (in Cs-based internal) were recorded from A17 in control and iberiotoxin to test for possible presynaptic effects of the BK channel antagonist. Traces in a and b are averages of 10 responses centered around corresponding numbers in the diary plot. (c) Pooled data from experiments in a and b. (d) Voltage-activated BK current (black) AMPAR-mediated EPSC (gray) from the same cell superimposed to demonstrate the similarity in kinetics. Gray dashed trace, EPSC inverted and scaled to the same amplitude as the BK current. (e) Pooled data comparing the time course of BK inactivation and EPSC decay across cells. Data in panels c and e represent mean ± SD.
Figure 6
Figure 6
BK channel-modulated Cav channels enhance GABA release from A17s. (a) Puffing 50 µM glutamate (25 ms) onto A17 dendrites elicited IPSCs in RBCs that were only minimally sensitive to the divalent Cav channel blocker Cd2+ (200 µM). (b) Blocking BK channels with iberiotoxin (100 nM) enhanced IPSCs (50 µM puff) and increased Cd2+ sensitivity. (c) Increasing the glutamate puff concentration (500 µM) elicited RBC IPSCs that were sensitive to Cd2+, providing evidence that Cav channels contribute to GABA release. (d) Application of iberiotoxin enhanced the IPSCs (500 µM puff) and increased the Cd2+ sensitivity of the response. (e) Summary of the results from experiments in ad. Bar graph indicates mean ± SD.
Figure 7
Figure 7
Modification of AMPAR kinetics with cyclothiazide recruits Cav channel-dependent enhancement of GABA release. (a) Electrically-evoked A17 EPSPs were strongly potentiated by cyclothiazide. (b) Summary of results from experiments described in a. (c) RBC IPSCs evoked by 50 µM glutamate puff were strongly enhanced by cyclothiazide application (50 µM). Cyclothiazide-enhanced IPSCs were reduced by Cd2+ (200 µM) application or abolished by the toxic serotonin analog DHT (50 µM; example trace not shown). (d) Summary of results from the experiment described in c. Bar graph indicates mean ± SD
Figure 8
Figure 8
BK channels in A17 amacrine cells modulate feedforward excitatory signaling at the RBC dyad. (a) EPSCs recorded in AII amacrine cells, reflecting synaptic output from RBCs, were reduced by iberiotoxin (IBTX, 100 nM; n = 8). Inset, Representative responses to 300 µs stimulation in control conditions (black) and the presence of iberiotoxin. (b) When A17s were ablated with 5,7-DHT, the BK channel-dependent modulation was strongly reduced. (b inset) Representative responses to 300 µs stimulation in the presence of 5,7-DHT (black) and with the addition of iberiotoxin (red; IBTX, 100 nM). (c) Summary of data in a and b, showing that iberiotoxin affected feedforward signaling when A17 amacrine cell feedback was intact. Data is represented as mean ± SD

References

    1. Dunn FA, Doan T, Sampath AP, Rieke F. Controlling the gain of rod-mediated signals in the Mammalian retina. J Neurosci. 2006;26:3959–3970. - PMC - PubMed
    1. Hartveit E. Reciprocal synaptic interactions between rod bipolar cells and amacrine cells in the rat retina. J Neurophysiol. 1999;81:2923–2936. - PubMed
    1. Nelson R, Kolb H. A17: a broad-field amacrine cell in the rod system of the cat retina. J Neurophysiol. 1985;54:592–614. - PubMed
    1. Singer JH, Diamond JS. Sustained Ca2+ entry elicits transient postsynaptic currents at a retinal ribbon synapse. J Neurosci. 2003;23:10923–10933. - PMC - PubMed
    1. Dong CJ, Hare WA. Temporal modulation of scotopic visual signals by A17 amacrine cells in mammalian retina in vivo. J Neurophysiol. 2003;89:2159–2166. - PubMed

Publication types

MeSH terms

Substances