

Combined atomic force microscopy and side-view optical imaging for mechanical studies of cells
- PMID: 19363493
- PMCID: PMC2810651
- DOI: 10.1038/nmeth.1320
Combined atomic force microscopy and side-view optical imaging for mechanical studies of cells
Abstract
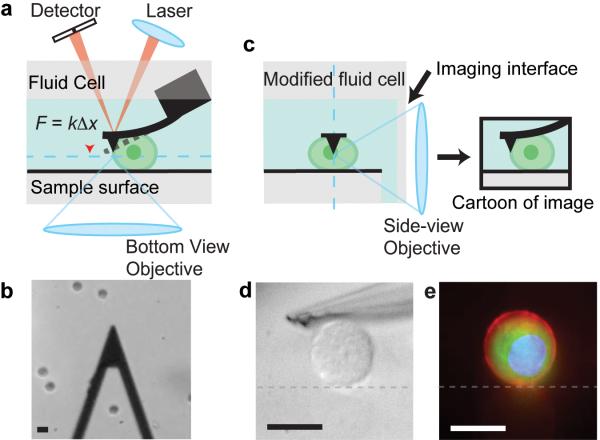
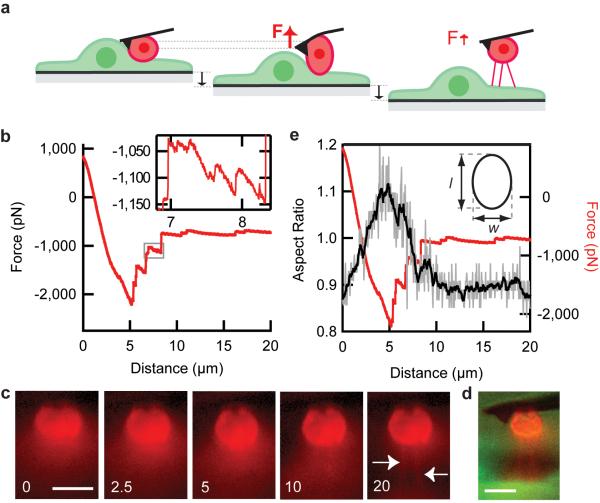
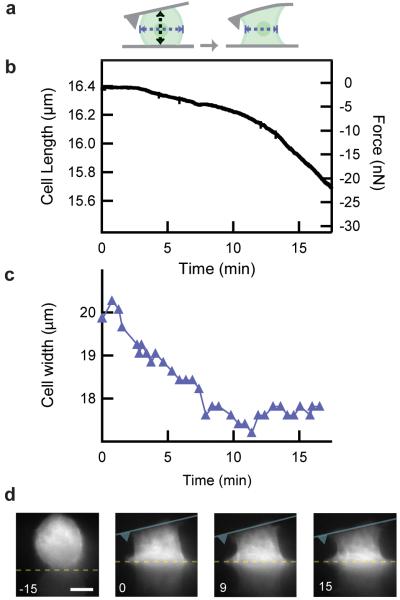
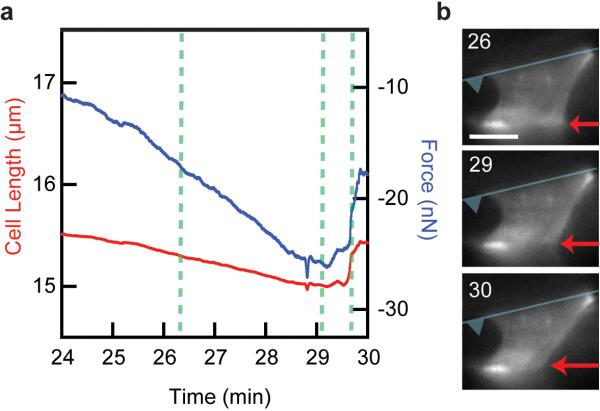
The mechanical rigidity of cells and adhesion forces between cells are important in various biological processes, including cell differentiation, proliferation and tissue organization. Atomic force microscopy has emerged as a powerful tool to quantify the mechanical properties of individual cells and adhesion forces between cells. Here we demonstrate an instrument that combines atomic force microscopy with a side-view fluorescent imaging path that enables direct imaging of cellular deformation and cytoskeletal rearrangements along the axis of loading. With this instrument, we directly observed cell shape under mechanical load, correlated changes in shape with force-induced ruptures and imaged formation of membrane tethers during cell-cell adhesion measurements. Additionally, we observed cytoskeletal reorganization and stress-fiber formation while measuring the contractile force of an individual cell. This instrument can be a useful tool for understanding the role of mechanics in biological processes.
Figures
Similar articles
-
Relationship between cell stiffness and stress fiber amount, assessed by simultaneous atomic force microscopy and live-cell fluorescence imaging.Biomech Model Mechanobiol. 2016 Jun;15(3):511-23. doi: 10.1007/s10237-015-0706-9. Epub 2015 Jul 24. Biomech Model Mechanobiol. 2016. PMID: 26206449 Free PMC article.
-
Biotechnological applications of atomic force microscopy.Methods Cell Biol. 2002;68:171-91. doi: 10.1016/s0091-679x(02)68009-4. Methods Cell Biol. 2002. PMID: 12053729 No abstract available.
-
Mechanosensing in actin stress fibers revealed by a close correlation between force and protein localization.J Cell Sci. 2009 May 15;122(Pt 10):1665-79. doi: 10.1242/jcs.042986. Epub 2009 Apr 28. J Cell Sci. 2009. PMID: 19401336
-
Molecular Tension Probes for Imaging Forces at the Cell Surface.Acc Chem Res. 2017 Dec 19;50(12):2915-2924. doi: 10.1021/acs.accounts.7b00305. Epub 2017 Nov 21. Acc Chem Res. 2017. PMID: 29160067 Free PMC article. Review.
-
Strategies and results of atomic force microscopy in the study of cellular adhesion.Micron. 2006;37(1):1-13. doi: 10.1016/j.micron.2005.06.006. Epub 2005 Jul 27. Micron. 2006. PMID: 16171998 Review.
Cited by
-
Microfluidics-based side view flow chamber reveals tether-to-sling transition in rolling neutrophils.Sci Rep. 2016 Jun 30;6:28870. doi: 10.1038/srep28870. Sci Rep. 2016. PMID: 27357741 Free PMC article.
-
Biomechanics of Neutrophil Tethers.Life (Basel). 2021 May 31;11(6):515. doi: 10.3390/life11060515. Life (Basel). 2021. PMID: 34073130 Free PMC article. Review.
-
Dynamic light scattering microrheology for soft and living materials.Soft Matter. 2021 Feb 21;17(7):1929-1939. doi: 10.1039/d0sm01597k. Epub 2021 Jan 11. Soft Matter. 2021. PMID: 33427280 Free PMC article.
-
Mechanobiology in lung epithelial cells: measurements, perturbations, and responses.Compr Physiol. 2012 Jan;2(1):1-29. doi: 10.1002/cphy.c100090. Compr Physiol. 2012. PMID: 23728969 Free PMC article. Review.
-
Quantifying single-platelet biomechanics: An outsider's guide to biophysical methods and recent advances.Res Pract Thromb Haemost. 2020 Feb 17;4(3):386-401. doi: 10.1002/rth2.12313. eCollection 2020 Mar. Res Pract Thromb Haemost. 2020. PMID: 32211573 Free PMC article. Review.
References
-
- Engler AJ, Sen S, Sweeney HL, Discher DE. Matrix elasticity directs stem cell lineage specification. Cell. 2006;126:677–689. - PubMed
-
- Paszek MJ, et al. Tensional homeostasis and the malignant phenotype. Cancer Cell. 2005;8:241–254. - PubMed
-
- Krieg M, et al. Tensile forces govern germ-layer organization in zebrafish. Nature Cell Biology. 2008;10:429–U122. - PubMed
Publication types
MeSH terms
Substances
Grants and funding
LinkOut - more resources
Full Text Sources
Other Literature Sources
