

doi: 10.1021/ac802330b.
Collisions or electrons? Protein sequence analysis in the 21st century
Affiliations
- PMID: 19364119
- PMCID: PMC2714553
- DOI: 10.1021/ac802330b
Item in Clipboard
Collisions or electrons? Protein sequence analysis in the 21st century
Anal Chem.
.
Abstract
How dissociation is effected determines the upstream sample handling whereas the spectral features it produces regulate the downstream informatics approach. (To listen to a podcast about this feature, please go to the Analytical Chemistry website at pubs.acs.org/journal/ancham.
Figures
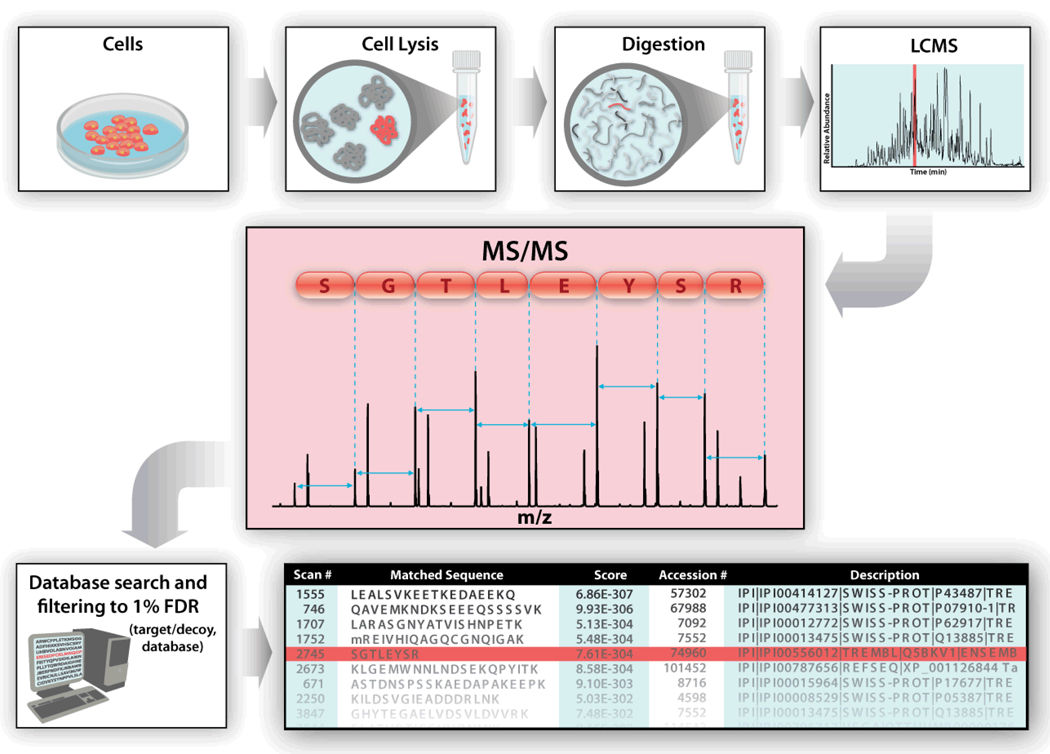
Overview of contemporary proteomics methodology. Extracted proteins are enzymatically digested to produce highly complex mixtures of peptides that are then sorted with one or multiple dimensions of chromatography. The final stage of chromatography is generally coupled to a mass spectrometer through an electrospray interface. Peptide precursor cations are selected for analysis by MS/MS to produce spectra like the one shown in the red box. The thousands of these spectra collected per hour are then exported to database correlation algorithms where spectra having good matches to peptides present in a database are displayed to the user. The success of this approach, however, relies heavily upon the MS/MS step producing a sufficient number of fragment ions for spectral matching.
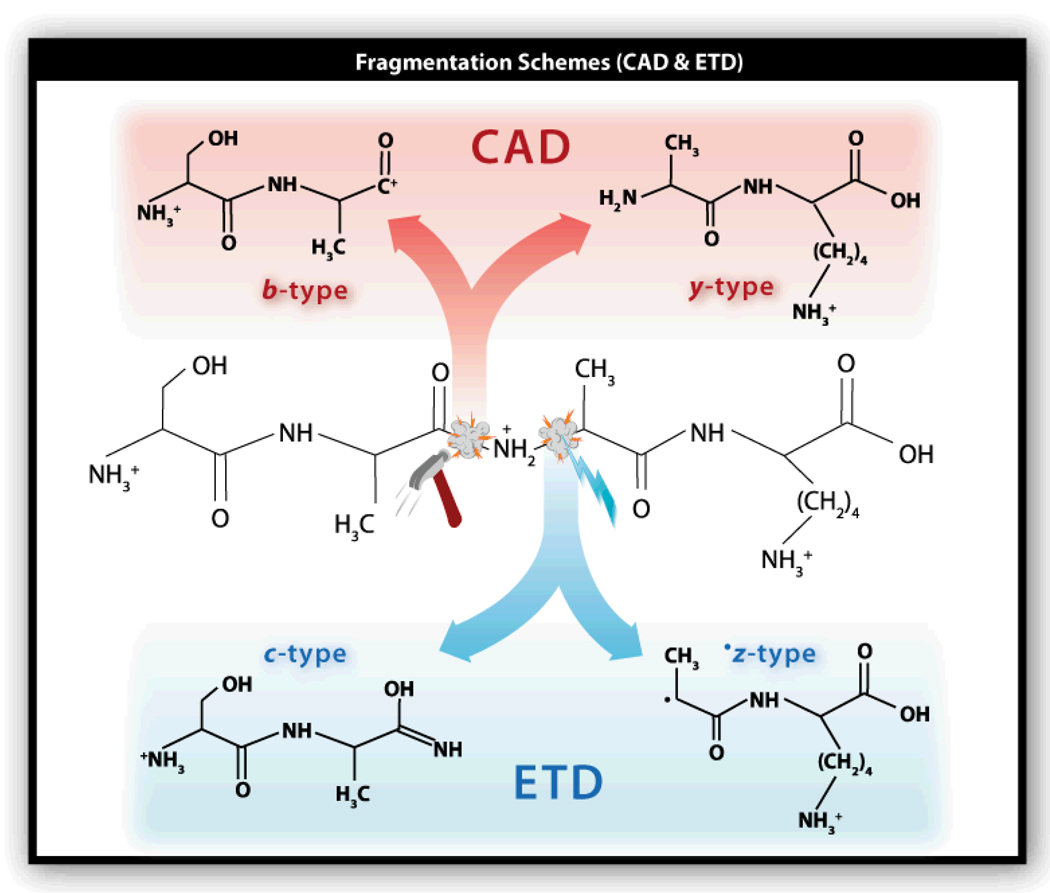
Diagram displaying the fragment ion types produced following either CAD or ETD.
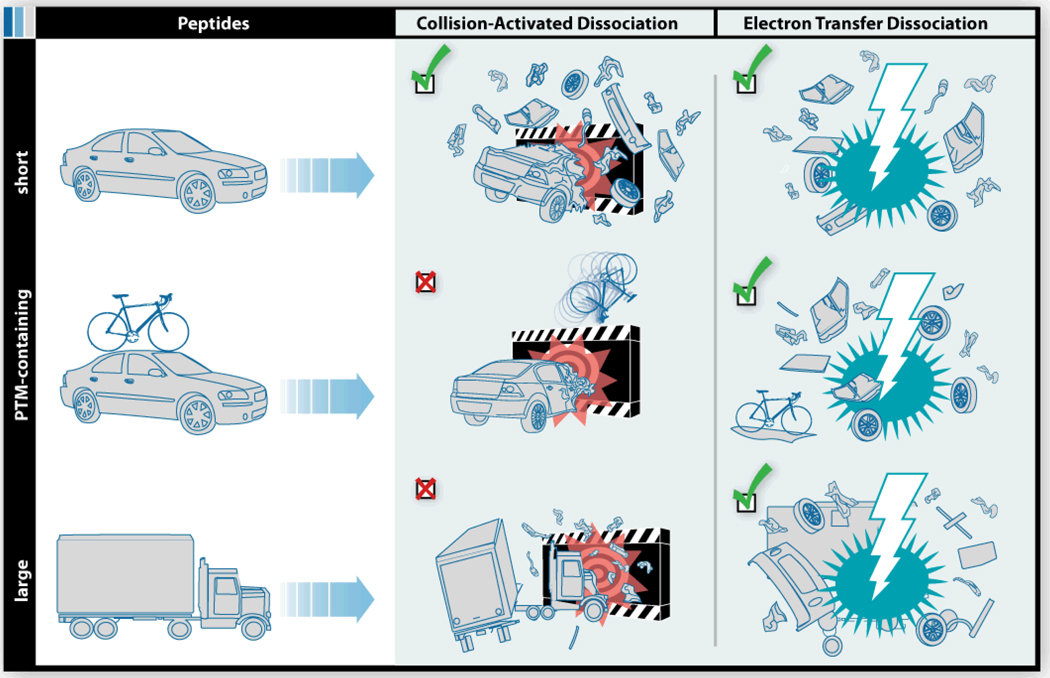
Cartoon illustrating three categories of peptide precursors – short, PTM-containing, and large. CAD is highly effective for peptides in the short category, but is generally less effective for those that are either large or PTM-containing. ETD is more or less indifferent to peptide length or the presence of PTMs.
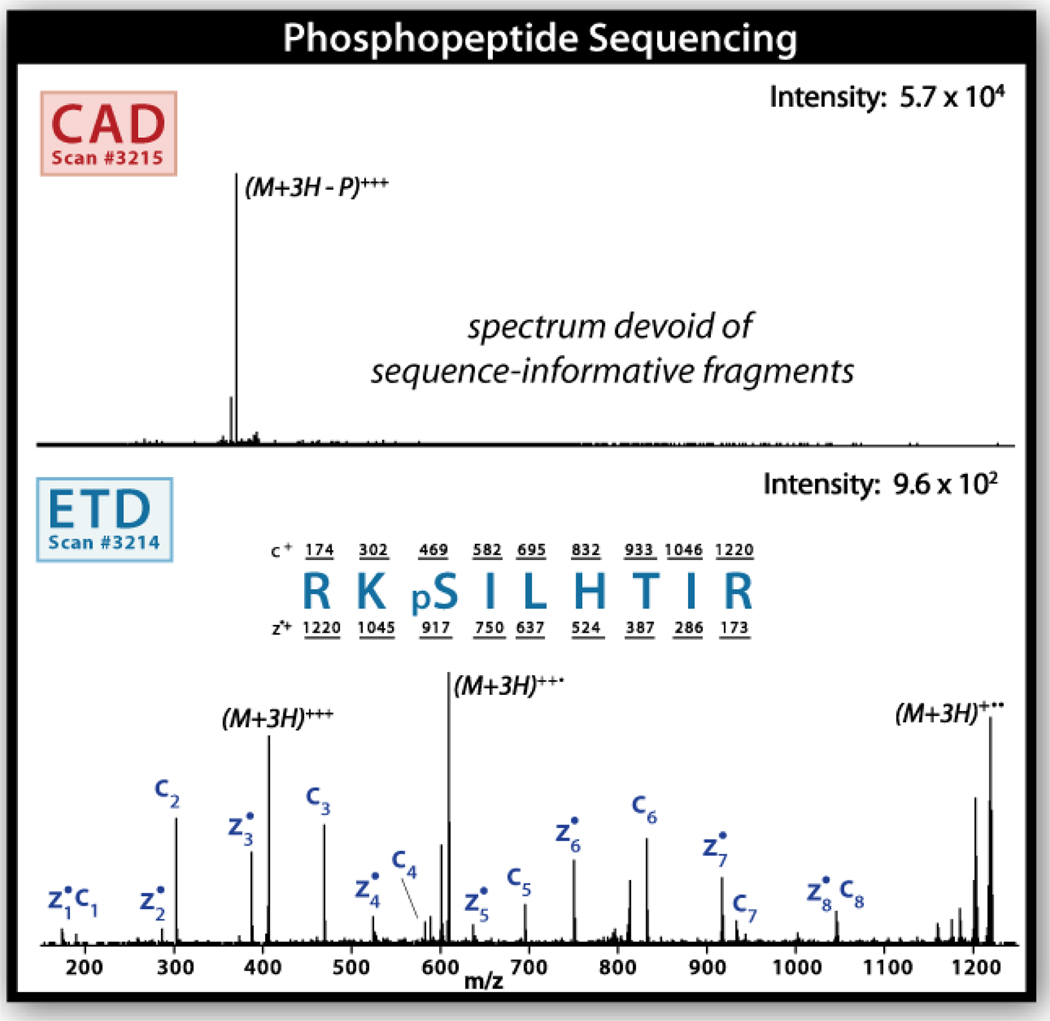
Tandem mass spectra obtained from a phosphopeptide eluted during a nHPLC-MS/MS experiment. The top panel displays the tandem mass spectrum produced following CAD. Note this spectrum is dominated by a single m/z corresponding to loss of a phosphoric acid moiety. No peptide backbone cleavage is observed. Sequence identification is impossible. The lower panel displays the tandem mass spectrum that is produced following ETD fragmentation. Here every single backbone cleavage product is observed. The sequence is easily assigned as RKpSILHTIR. Both panels display single-scan mass spectra.
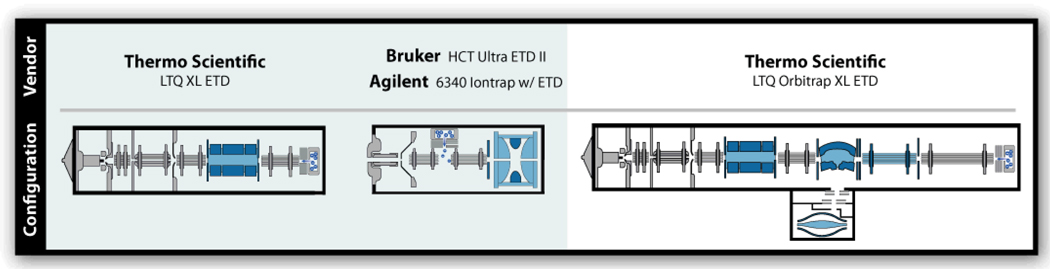
Diagram of the four commercial ETD-enabled MS systems.
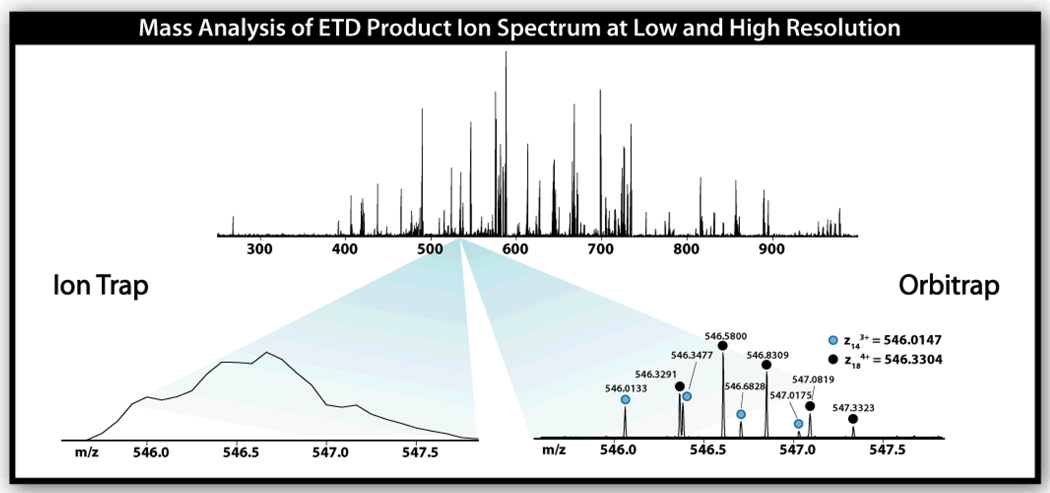
ETD product ion spectra following dissociation of a 24 residue peptide. Numerous c- and z•-type fragment ions are generated and detected. The insets display a small m/z region when analysis of these products was performed either with the ion trap or orbitrap. Here the mass resolution offered by the orbitrap allows for unambiguous identification of two closely spaced isotopic clusters of z•-type fragment ions. This figure was adapted from reference .
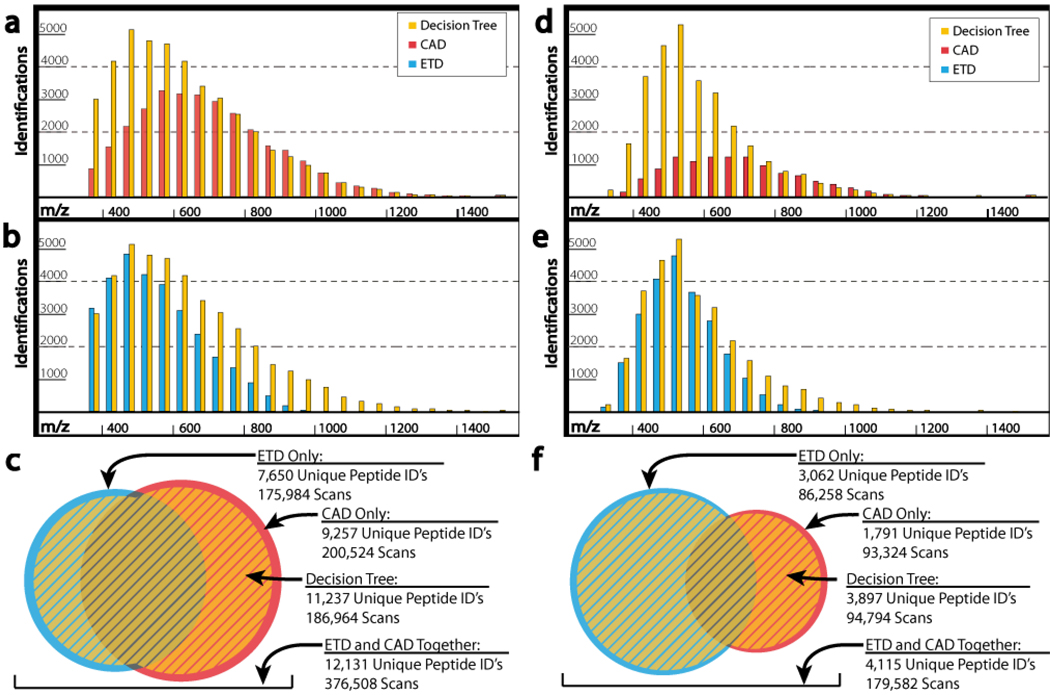
Distribution of identified peptides using either the CAD (red), ETD (blue), or DT (yellow) methods. The grouping on the left (a–c) display the number of identified peptides for each method as a function of precursor m/z ratio for unmodified peptides (yeast) – while the grouping on the right (d–f) show the same for a phosphopeptide dataset. Panels c and f show the redundancy and complementary between the unique peptides identified during the CAD- and ETD-only analyses for the unmodified and PTM-containing datasets, respectively. The yellow area present in each indicates the coverage provided by the DT algorithm, which is > 90 % of that observed upon combination of the CAD- and ETD-only. This figure was adapted from reference .
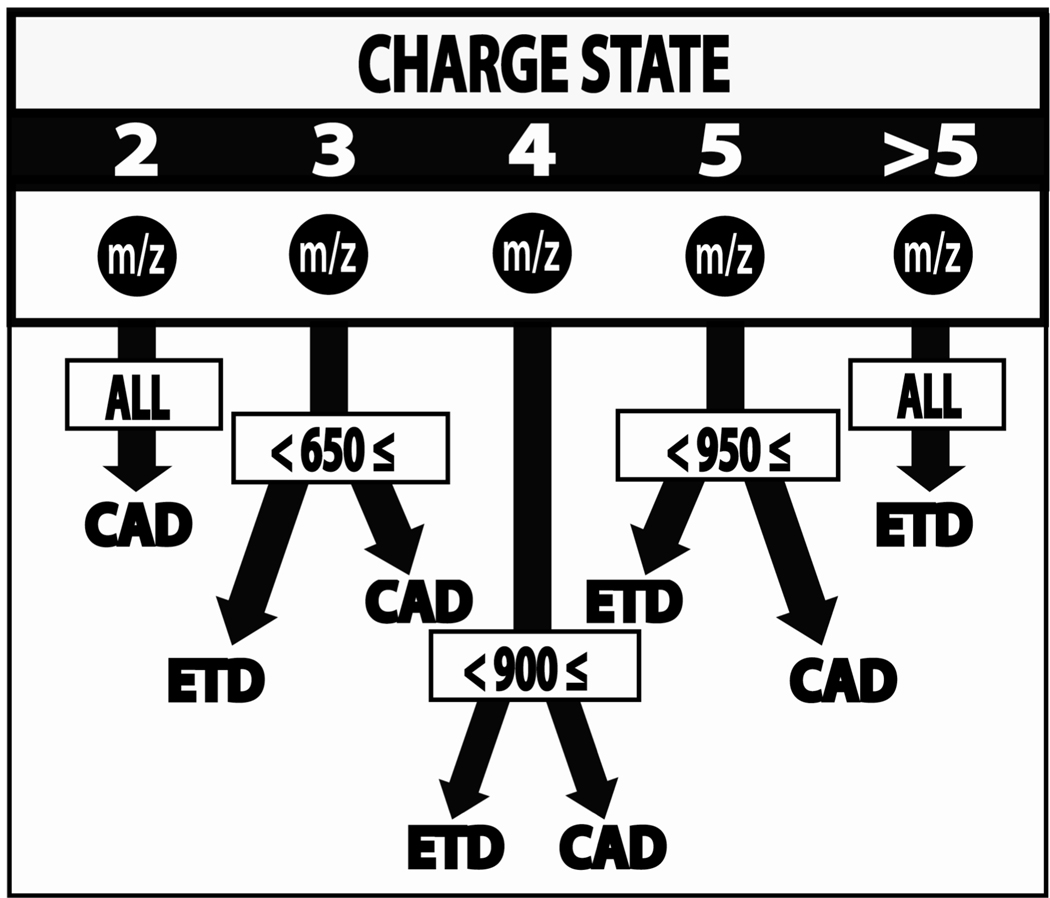
Schematic representation of the probabilistic decision tree (DT) algorithm. Note, m/z is the mass-to-charge ratio of the precursor selected for MS/MS interrogation.
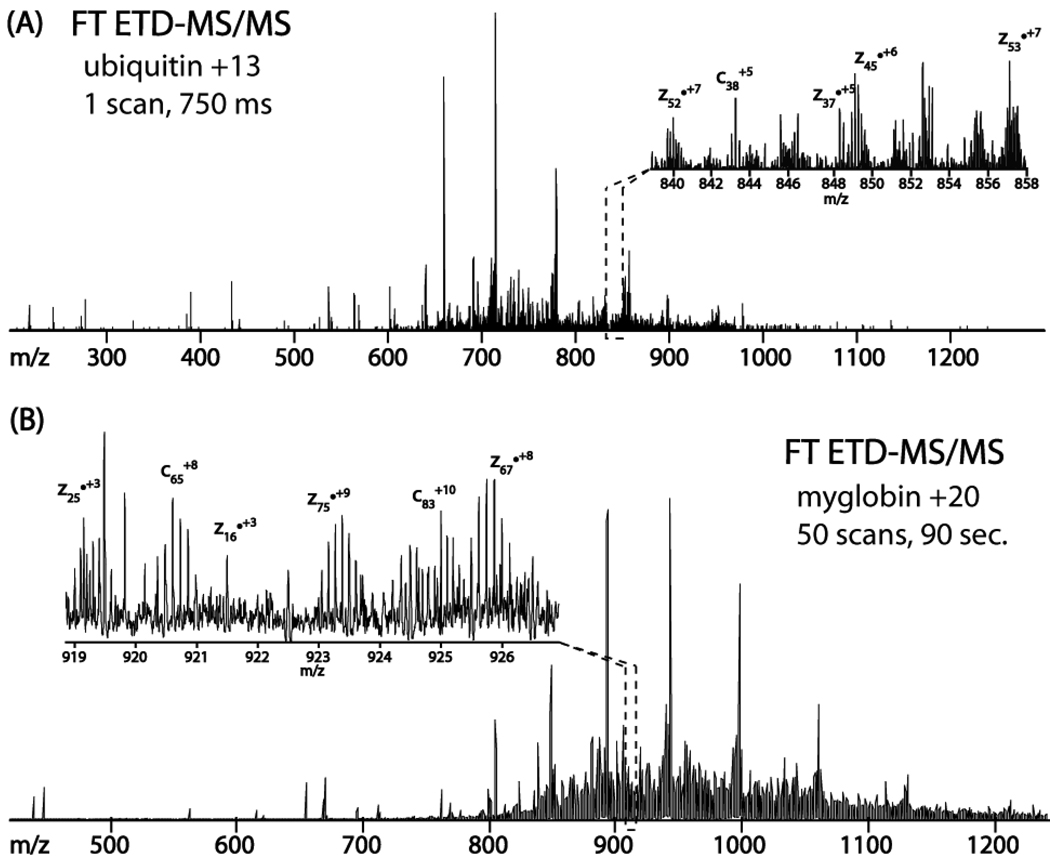
Panel A presents a FT ETD-MS/MS single scan spectrum of the ubiquitin +13 precursor (m/z 659). This spectrum was collected in 750 ms and harbored 112 of 150 possible backbone fragments to yield 88% sequence coverage. The +20 charge state of myoglobin, a 17 kDa protein, was subjected to ETD followed by orbitrap m/z analysis. Inspection of the spectra, fifty averaged scans, revealed 127 of 304 possible backbone fragments, translating to 55% sequence coverage. This figure was adapted from reference .
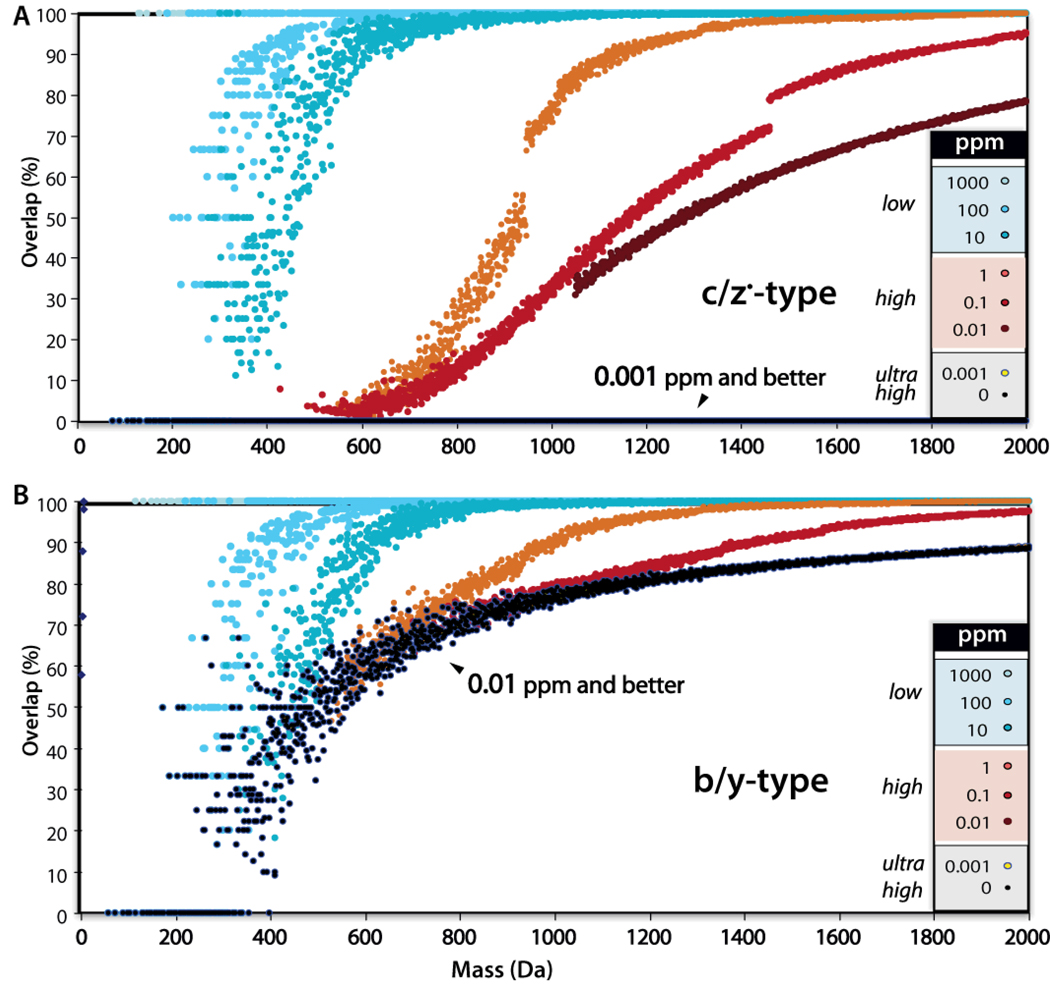
Comparative analysis of ambiguity in complementary ion pairs at various mass accuracies. These data demonstrate that with perfect mass accuracy b- and y-type ions often overlap and cannot be distinguished by mass alone; however, c- and z•-type fragment ions are always distinguished with perfect accuracy and even at 1 ppm the majority of peaks below 1000 Da can be assigned an ion type. This figure was adapted from reference .
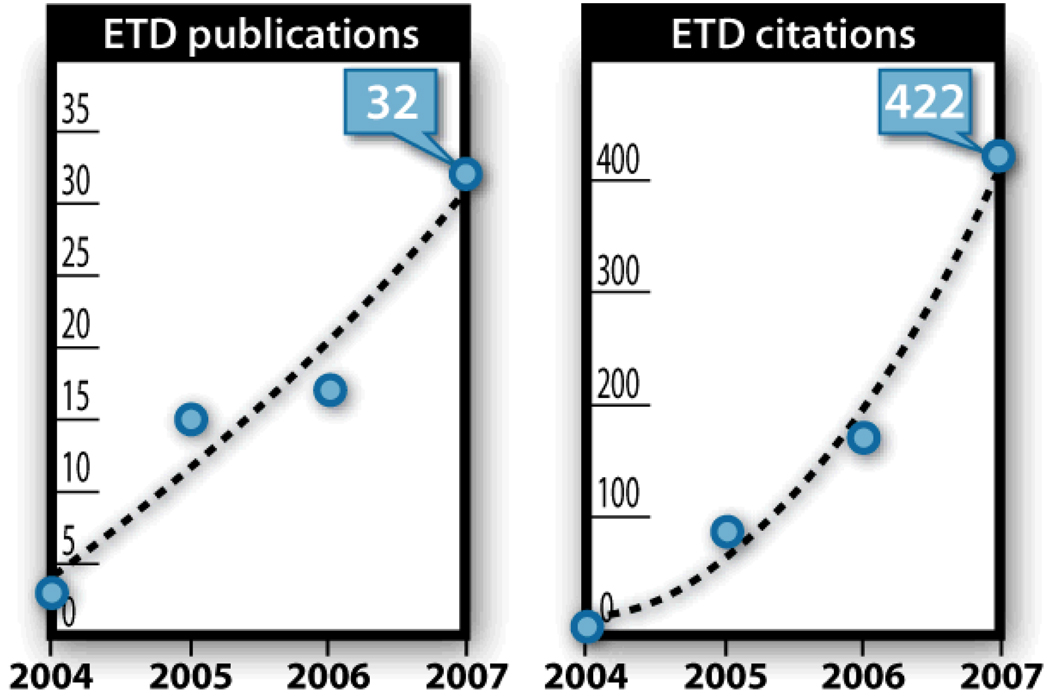
The number of peer-reviewed publications on the subject of ETD (left) and the number of citations garnered by those papers (right).
References
-
- McLafferty FW, Venktaraghavan R, Irving P. Biochemical and Biophysical Research Communications. 1970;39 - PubMed
-
- Wipf HK, Irving P, McCamish M, Venkataraghavan R, McLafferty FW. Journal of the American Chemical Society. 1973;95 - PubMed
-
- Zubarev RA, Kelleher NL, McLafferty FW. Journal of the American Chemical Society. 1998;120:3265–3266.
-
- Kruger NA, Zubarev RA, Horn DM, McLafferty FW. International Journal of Mass Spectrometry. 1999;187:787–793.
Publication types
MeSH terms
Substances
Grants and funding
LinkOut - more resources
Full Text Sources
