

The detection of pressure fluctuations, sonic audition, is the dominant mode of dipole-source detection in goldfish (Carassius auratus)
- PMID: 19364230
- PMCID: PMC2745211
- DOI: 10.1037/a0013683
The detection of pressure fluctuations, sonic audition, is the dominant mode of dipole-source detection in goldfish (Carassius auratus)
Abstract
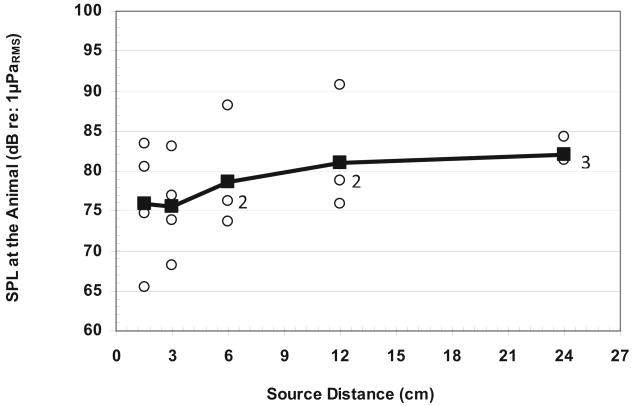
Behavioral detection of a low-frequency (40 Hz) vibratory dipole at source distances of 1.5-24 cm was measured by classically conditioned respiratory suppression in goldfish (Carassius auratus). Detection thresholds were compared across distances and before and after ablation of individual octavolateralis sensory channels. Detection thresholds, expressed in units of pressure (SPL), remained roughly constant as distance between the stimulus source and animal increased. Lateral line inactivation, using CoCl2, had no measurable effect on sensitivity, although some other results can be construed as weak evidence for a small contribution of the lateral line to dipole detection when source distances are <or=6 cm (<1 body length). Gas bladder deflation resulted in a large increase in threshold (17 dB), demonstrating that the gas bladder contributes to audition at low frequencies. The present study confirms an auditory role for the gas bladder-enhanced inner ear of goldfish in the detection of low-frequency vibratory sources. Sonic audition (detection of pressure fluctuations) appears to be the dominant mode of dipole-source detection for goldfish when measured by conditioned behaviors in psychophysical experiments.
Copyright (c) 2009 APA, all rights reserved.
Figures


Similar articles
-
Perception of frequency, amplitude, and azimuth of a vibratory dipole source by the octavolateralis system of goldfish (Carassius auratus).J Comp Psychol. 2011 Aug;125(3):286-95. doi: 10.1037/a0023499. J Comp Psychol. 2011. PMID: 21574689 Free PMC article.
-
Nearfield detection of dipole sources by the goldfish (Carassius auratus) and the mottled sculpin (Cottus bairdi).J Exp Biol. 1994 May;190:109-29. doi: 10.1242/jeb.190.1.109. J Exp Biol. 1994. PMID: 7964388
-
Intensity discrimination of pulsed tones by the goldfish (Carassius auratus).J Acoust Soc Am. 1989 Jan;85(1):500-2. doi: 10.1121/1.397704. J Acoust Soc Am. 1989. PMID: 2921423
-
The overlapping roles of the inner ear and lateral line: the active space of dipole source detection.Philos Trans R Soc Lond B Biol Sci. 2000 Sep 29;355(1401):1115-9. doi: 10.1098/rstb.2000.0650. Philos Trans R Soc Lond B Biol Sci. 2000. PMID: 11079381 Free PMC article. Review.
-
Structure and function in the saccule of the goldfish (Carassius auratus): a model of diversity in the non-amniote ear.Hear Res. 2000 May;143(1-2):1-13. doi: 10.1016/s0378-5955(00)00015-0. Hear Res. 2000. PMID: 10771179 Review.
Cited by
-
Dipole source encoding and tracking by the goldfish auditory system.J Exp Biol. 2010 Oct 15;213(Pt 20):3536-47. doi: 10.1242/jeb.044909. J Exp Biol. 2010. PMID: 20889834 Free PMC article.
-
Vibratory sources as compound stimuli for the octavolateralis systems: dissection of specific stimulation channels using multiple behavioral approaches.J Exp Psychol Anim Behav Process. 2010 Apr;36(2):243-57. doi: 10.1037/a0016747. J Exp Psychol Anim Behav Process. 2010. PMID: 20384404 Free PMC article.
-
The oscar, Astronotus ocellatus, detects and discriminates dipole stimuli with the lateral line system.J Comp Physiol A Neuroethol Sens Neural Behav Physiol. 2011 Oct;197(10):959-68. doi: 10.1007/s00359-011-0656-3. Epub 2011 Jun 12. J Comp Physiol A Neuroethol Sens Neural Behav Physiol. 2011. PMID: 21667267
-
Signal-to-noise ratio for source determination and for a comodulated masker in goldfish, Carassius auratus.J Acoust Soc Am. 2011 May;129(5):3367-72. doi: 10.1121/1.3562179. J Acoust Soc Am. 2011. PMID: 21568437 Free PMC article.
-
Hydrodynamic perception in true seals (Phocidae) and eared seals (Otariidae).J Comp Physiol A Neuroethol Sens Neural Behav Physiol. 2013 Jun;199(6):421-40. doi: 10.1007/s00359-012-0778-2. Epub 2012 Nov 24. J Comp Physiol A Neuroethol Sens Neural Behav Physiol. 2013. PMID: 23180048 Review.
References
-
- Braun CB, Coombs S, Fay RR. What is the nature of multisensory interaction between octavolateralis sub-systems? Brain, Behavior and Evolution. 2002;59:162–176. - PubMed
-
- Braun CB, Grande T. Evolution of peripheral mechanisms for the enhancement of sound reception. In: Popper AN, Fay RR, Webb JL, editors. Springer handbook of auditory research: Fish bioacoustics. New York: Springer-Verlag; 2008. pp. 99–144.
-
- Cahn P, editor. Lateral line detectors: Proceedings of a conference held at Yeshiva University; New York. April 16–18, 1966; Bloomington: Indiana University Press; 1967.
-
- Coombs S. Nearfield detection of dipole sources by the goldfish (Carassius auratus) and the mottled sculpin (Cottus bairdi) Journal of Experimental Biology. 1994;190:109–129. - PubMed
-
- Coombs S, Braun CB, Donovan B. Orienting response of Lake Michigan mottled sculpin is mediated by canal neuromasts. Journal of Experimental Biology. 2001;204:337–348. - PubMed
Publication types
MeSH terms
Substances
Grants and funding
LinkOut - more resources
Full Text Sources
Miscellaneous
