

Review
doi: 10.1016/j.mric.2008.12.002.
Susceptibility-weighted imaging: clinical angiographic applications
Affiliations
- PMID: 19364599
- PMCID: PMC2713115
- DOI: 10.1016/j.mric.2008.12.002
Item in Clipboard
Review
Susceptibility-weighted imaging: clinical angiographic applications
Magn Reson Imaging Clin N Am.
2009 Feb.
Abstract
By combining filtered phase and magnitude information to create a novel and intrinsic source of contrast, susceptibility-weighted imaging (SWI) has shown great promise in clinical angiography and venography. SWI has contributed to new insights into traumatic brain injury, the role of calcification in atherosclerosis, and the possible relationship between blood settling and deep venous thrombosis. A further contribution from SWI to deep venous thrombosis research (and also stroke) involves its application to the noninvasive measurement of oxygen saturation in the brain and in other tissues. Altogether, SWI offers manifold and diverse avenues for further research using angiographic and venographic techniques.
Figures
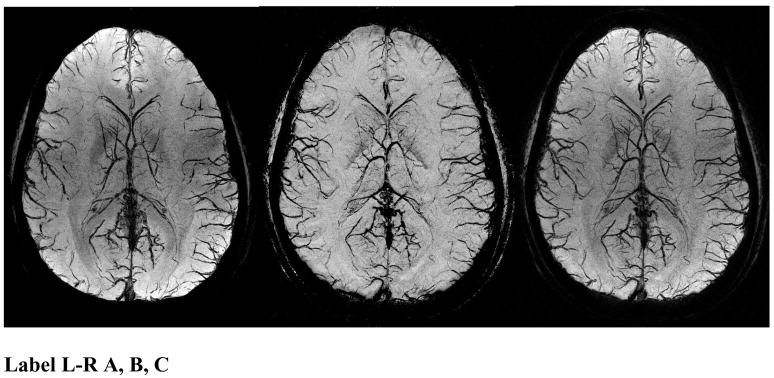
SWI data at 4T showing an mIP over 26mm of the magnitude (A, left), phase (B, center), and SW (C, right) images. The SW images combine the contrast of the magnitude and phase images. Note the magnitude and the SW processed data both have spatial inhomogeneities from rf penetration effects while the phase image (b) is remarkably uniform.
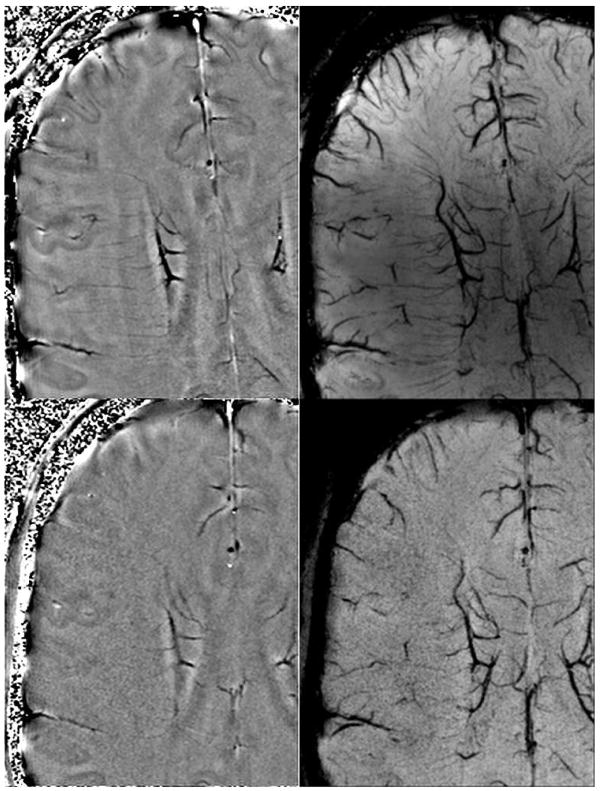
Filtered phase images (A & B, left top and left bottom) and mIP of SW images over 8mm (C & D, right top and right bottom) at 3T (B, D bottom) and 7T (A,C top) at identical resolutions on the same volunteer. This shows the improved visualization of veins at higher fields due to the higher SNR and increased susceptibility even at the same resolution. Imaging parameters are TR/TE/FA = 45ms/28ms/15° at 3T and 35ms/16ms/15° at 7T with identical resolutions of 0.44×0.44×2mm3 (images courtesy of Yulin Ge, New York University).
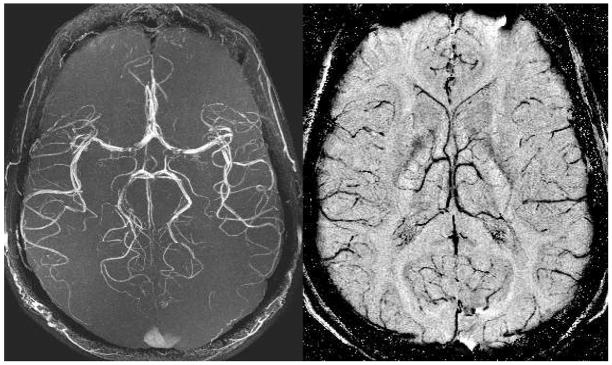
Both the MRA maximum intensity projection over 128 slices (A, left) and the minimum intensity projection over 32 SWI filtered phase slices (B, right) are acquired from a single echo SWI data set. The data were acquired at 3T with: TR = 35ms, TE = 15ms, FA = 15°, 0.5mm isotropic resolution, and 128 partitions. These high resolution scans depict the usual M4 arteries with excellent edge definition. There are some flow related losses in the MCA. The venous network is seen to be quite different than the arterial network in its distribution of vessels.
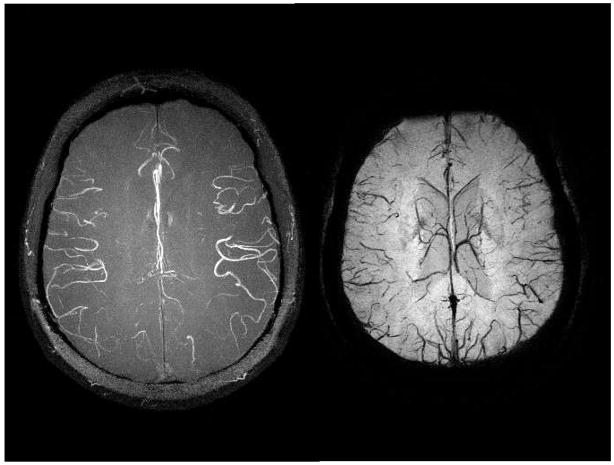
Both the MRA maximum intensity projection (A, left) and the minimum intensity projection over SWI processed data (B, right) are acquired from a single echo SWI data set with 0.5mm isotropic resolution. The data were acquired at 4T with: TR = 26ms, TE = 15ms, FA = 11°, and 80 partitions. These high resolution scans depict the usual M4 arteries with excellent edge definition. Again, the venous anatomy is seen to be quite different than the arterial pattern. The 4T image shows the capability of higher fields to produce better MRAV images.
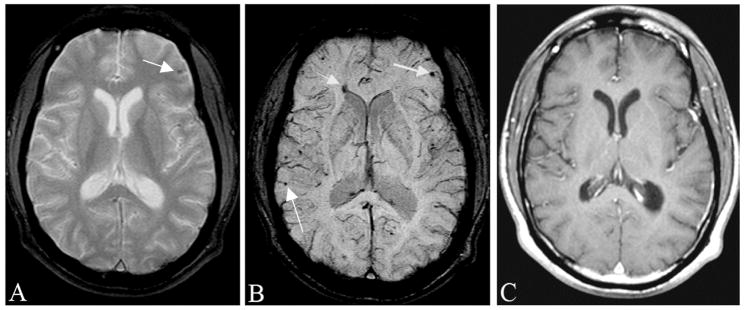
Traumatic brain injury is often occult to conventional imaging methods in CT or MRI. Here, we show a case of a motorcycle accident where conventional MR methods were unable to locate the many bleeds present. A, The gradient echo image shows some sign of a microbleed (arrow). B, SWI shows a number of venous confluences (particularly striking is the junction of the medullary veins with the septal vein) that have shearing injury. The smaller microbleeds are likely due to shearing of the venules (see also Figure 12). C, The post-contrast T1-weighted image shows no evidence of vascular damage.
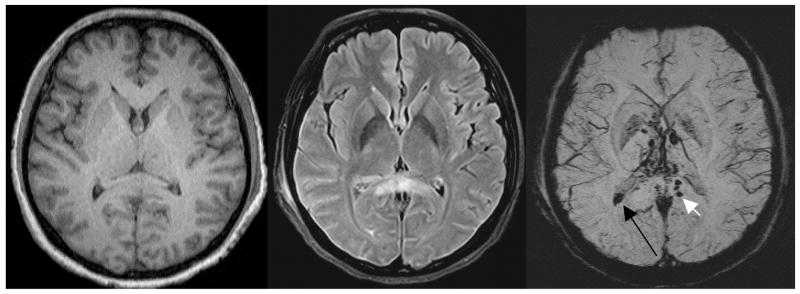
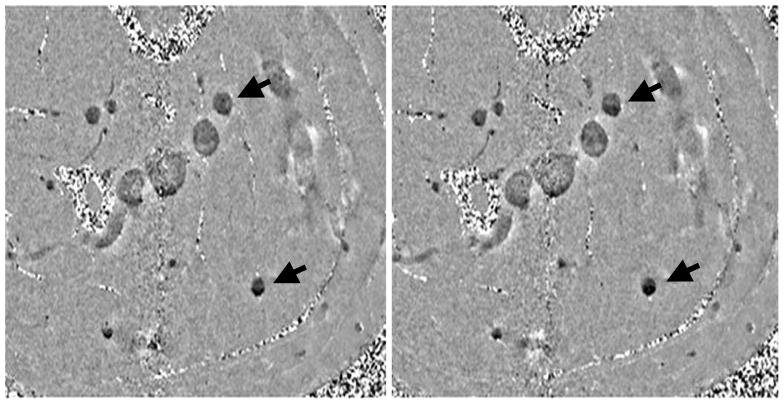
An example of severe traumatic brain injury. The T1 image (A, left) shows dark signal in the lateral horns of the ventricles and some suspicious low signal intensity in the corpus callosum. The FLAIR image (B, center) shows some edema in the corpus callosum. The SWI data (C, right) clearly shows a hemorrhage inside the posterior horn of the right lateral ventricle (long black arrow) and a hemorrhage in the corpus callosum (short white arrow). (Images courtesy of Lei Jing, Tianjin Huan Hospital, China.)
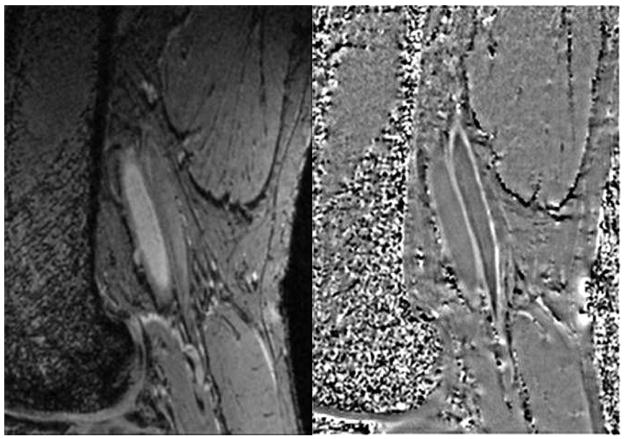
Delineation of femoral artery wall in a normal subject. Magnitude image (A, left) shows the lumen bright which serves as a good marker between the inside wall and blood. Note the vessel wall is straight with no indication of wall thickening. The phase image (B, right) shows the vessel wall with a brighter than background signal indicating that the vessel wall is diamagnetic. The phase of the venous wall appears to be brighter than that of the arterial wall indicating it is even more diamagnetic than the arterial wall.
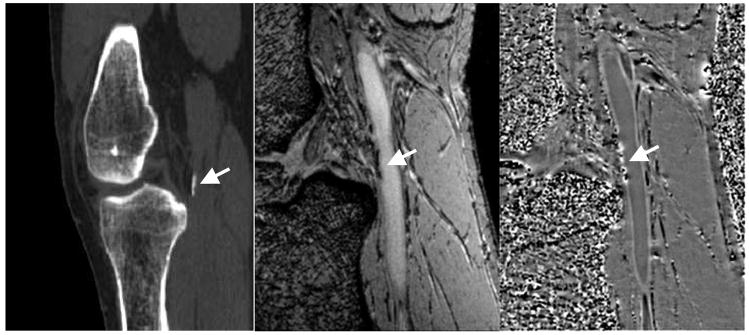
CT scan (A,left) showing calcification at the edge of the popliteal artery just behind the knee. Magnitude gradient echo image (B, center) showing the signal loss from the calcification in the same area. SWI filtered phase image (C, right) showing the diamagnetic effect from the calcification. Note the similar shape and extent of the calcification in both the CT and MR results.
(A, Left) early scan (~10min) and (B, right) late scan (~40min). Notice in the late scan the dark layers on the bottom are more prominent than in the early scan. Male, age 54.
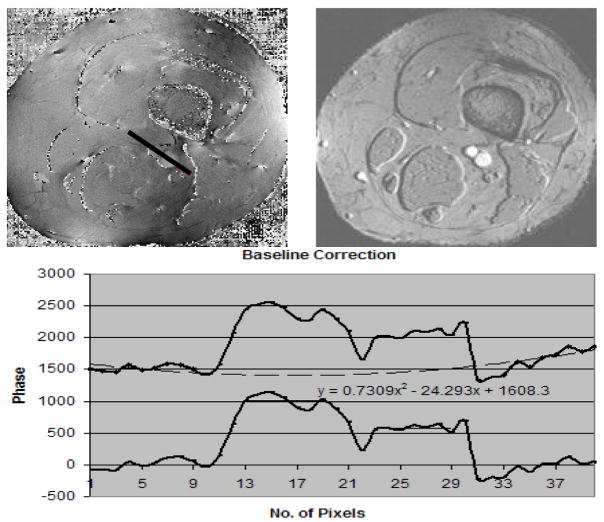
(A, the top left image) is the associated phase image to B (the top right image) which represents the magnitude image from a TE = 25ms scan The fitted line shows the profile through the phase of the background, artery and vein. The phase values along the profile (black line starting from bottom right moving to top left of the line) in the A runs through the background tissue, artery and vein which are measured. The phase values from the background are then fitted to a parabola and subtracted from the phases along the profile (black line) to create a background corrected phase of the artery (larger vessel) and vein (smaller vessel).
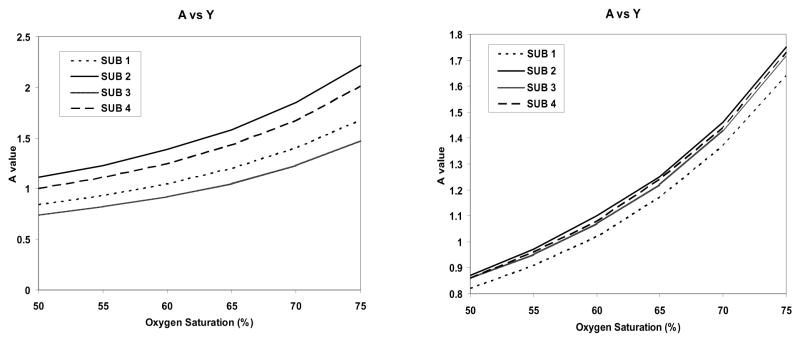
A(left) Plot of A versus oxygen saturation for the 4 subjects using a high pass filter approach to remove low spatial frequency background. B (right) Plot of A versus oxygen saturation for the 4 subjects using a least squares fit to a two dimensional quadratic function to remove the phase. If the oxygen saturation is known to be 70% that would suggest that A = 1.5.
References
-
- Reichenbach JR, Venkatesan R, Schillinger DJ, et al. Small vessels in the human brain: MR venography with deoxyhemoglobin as an intrinsic contrast agent. Radiology. 1997 Jul;204(1):272–277. - PubMed
-
- Haacke EM, Dmitriy SL, Yablonskiy A, et al. In vivo validation of the bold mechanism: A review of signal changes in gradient echo functional MRI in the presence of flow. International Journal of Imaging Systems and Technology. 1995;6(2–3):153–163.
-
- Ashwal S, Babikian T, Gardner-Nichols J, et al. Susceptibility-weighted imaging and proton magnetic resonance spectroscopy in assessment of outcome after pediatric traumatic brain injury. Arch Phys Med Rehabil. 2006 Dec;87(12 Suppl 2):S50–58. - PubMed
-
- Babikian T, Freier MC, Tong KA, et al. Susceptibility weighted imaging: neuropsychologic outcome and pediatric head injury. Pediatr Neurol. 2005 Sep;33(3):184–194. - PubMed
-
- Barth M, Nobauer-Huhmann IM, Reichenbach JR, et al. High-resolution three-dimensional contrast-enhanced blood oxygenation level-dependent magnetic resonance venography of brain tumors at 3 Tesla: first clinical experience and comparison with 1.5 Tesla. Invest Radiol. 2003 Jul;38(7):409–414. - PubMed
Publication types
MeSH terms
Substances
Grants and funding
LinkOut - more resources
Full Text Sources
Other Literature Sources
