

Review
doi: 10.1098/rsbl.2009.0155.
Epub 2009 Apr 8.
Effective population size and the rate and pattern of nucleotide substitutions
Affiliations
- PMID: 19364708
- PMCID: PMC2679941
- DOI: 10.1098/rsbl.2009.0155
Item in Clipboard
Review
Effective population size and the rate and pattern of nucleotide substitutions
Biol Lett.
.
Abstract
Both the overall rate of nucleotide substitution and the relative proportions of synonymous and non-synonymous substitutions are predicted to vary between species that differ in effective population size (N(e)). Our understanding of the genetic processes underlying these lineage-specific differences in molecular evolution is still developing. Empirical analyses indicate that variation in substitution rates and patterns caused by differences in N(e) is often substantial, however, and must be accounted for in analyses of molecular evolution.
Figures
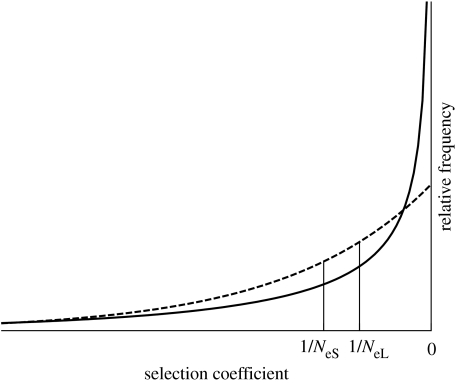
The distributions of fitness effects modelled by Ohta (1977) (exponential or gamma with β=1, dashed curve) and Kimura (1979) (gamma with β=0.5, solid curve). In a small population, with effective population size NeS, mutations with selection coefficients between 1/NeS and zero will be effectively neutral. Fewer mutations, those with selection coefficients between 1/NeL and zero, will be effectively neutral in a larger population with NeL. The proportion of mutations that have selective coefficients between 1/NeS and 1/NeL will be greater under a gamma distribution of fitness effects with β=1 than with β=0.5 for most regions of parameter space.
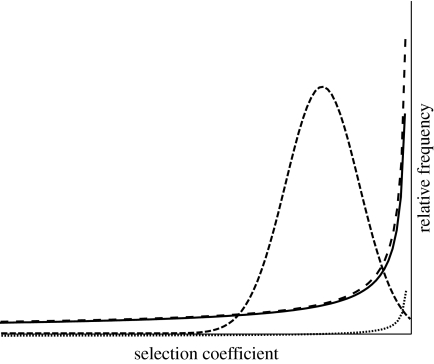
Example distributions of fitness effects estimated from different datasets, including lognormal for Drosophila miranda and Drosophila pseudoobscura (Loewe & Charlesworth 2006; dotted curve), strongly leptokurtic gamma for Drosophila melanogaster (solid curve) and human (spaced dashed curve) nuclear genes (Keightley & Eyre-Walker 2007), and normal for primate mitochondrial genes (Nielsen & Yang 2003; closed dashed curve).
References
-
- Bachtrog D. Similar rates of protein adaptation in Drosophila miranda and D. melanogaster, two species with different current effective population sizes. BMC Evol. Biol. 2008;8:334. doi:10.1186/1471-2148-8-334 - DOI - PMC - PubMed
-
- Chamary J.V., Parmley J.L., Hurst L.D. Hearing silence: non-neutral evolution at synonymous sites in mammals. Nat. Rev. Genet. 2006;7:98–108. doi:10.1038/nrg1770 - DOI - PubMed
-
- Charlesworth B. Effective population size and patterns of molecular evolution and variation. Nat. Rev. Genet. 2009;10:195–205. doi:10.1038/nrg2526 - DOI - PubMed
-
- Charlesworth J., Eyre-Walker A. The other side of the nearly neutral theory, evidence of slightly advantageous back-mutations. Proc. Natl Acad. Sci. USA. 2007;104:16 992–16 997. doi:10.1073/pnas.0705456104 - DOI - PMC - PubMed
-
- Eyre-Walker A. The genomic rate of adaptive evolution. Trends Ecol. Evol. 2006;21:569–575. doi:10.1016/j.tree.2006.06.015 - DOI - PubMed
Publication types
MeSH terms
Substances
LinkOut - more resources
Full Text Sources
