. 2009 Jun;29(12):3413-23.
doi: 10.1128/MCB.00020-09. Epub 2009 Apr 13.

Coactivator function defines the active estrogen receptor alpha cistrome

Affiliations

Coactivator function defines the active estrogen receptor alpha cistrome

Mathieu Lupien et al. Mol Cell Biol. 2009 Jun.

Abstract

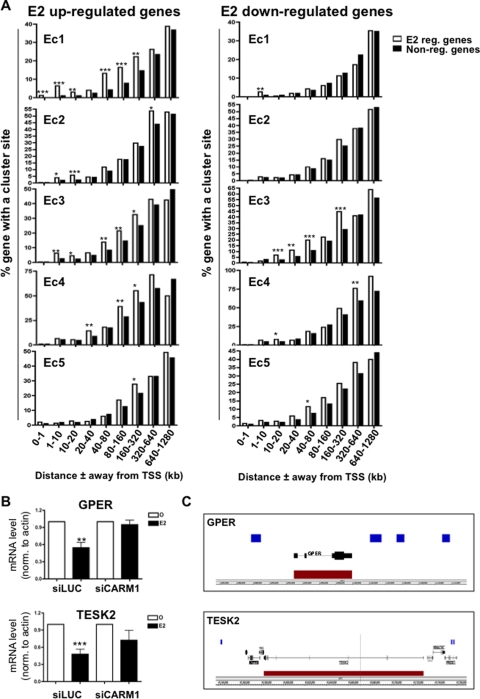
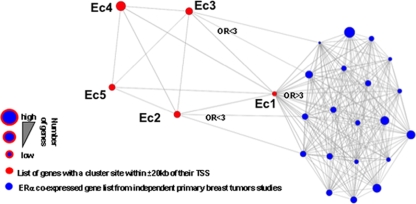
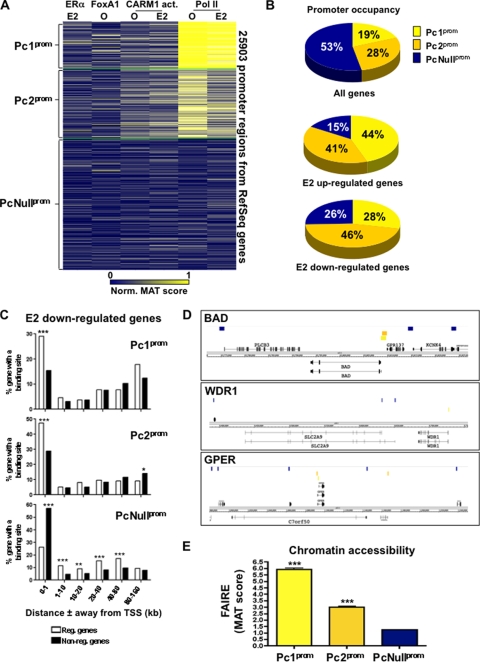
Proper activation of transcriptional networks in complex organisms is central to the response to stimuli. We demonstrate that the selective activation of a subset of the estrogen receptor alpha (ERalpha) cistrome in MCF7 breast cancer cells provides specificity to the estradiol (E2) response. ERalpha-specific enhancers that are subject to E2-induced coactivator-associated arginine methyltransferase 1 (CARM1) action are critical to E2-stimulated gene expression. This is true for both FoxA1-dependent and independent enhancers. In contrast, a subset of E2-suppressed genes are controlled by FoxA1-independent ERalpha binding sites. Nonetheless, these are sites of E2-induced CARM1 activity. In addition, the MCF7 RNA polymerase II cistrome reveals preferential occupancy of E2-regulated promoters prior to stimulation. Interestingly, E2-suppressed genes tend to lie in otherwise silent genomic regions. Together, our results suggest that the transcriptional response to E2 in breast cancer cells is dependent on the interplay between polymerase II pre-occupied promoters and the subset of the ERalpha cistrome associated with coactivation.


Figures

FIG. 1.
FIG. 1.
Establishing classes of enhancer-rich clusters under E2 treatment. (A) Cluster analysis according to the binding activity for the transcription factor ERα, the pioneer factor FoxA1, the mark of CARM1 activity (an antibody raised against dimethylation of arginine 17 on histone H3), and Pol II across the 25,416 high-confidence regions recruiting at least one factor from all analyzed cistromes established through unbiased genome-wide ChIP-on-ChIP in MCF7 breast cancer cells (E2, E2 treated for 45 min; O, vehicle treated). (B) Genomic distribution of binding sites found in each cluster with regard to the TSS of known genes using the cis-regulatory element annotation system (28). (C) Average MAT scores of ERα and FoxA1 and the difference in CARM1 activity between E2-treated and control MCF7 cells in each cluster. The average MAT score signal for ERα or FoxA1 for the various clusters significantly different from a 1.5 average MAT score is presented. Similarly, the average change in CARM1 activity MAT score significantly different from 1 between E2- and vehicle-treated cells is presented. *, P ≤ 0.05; **, P ≤ 0.01; ***, P ≤ 0.001. (D) Half-ERE and Forkhead (FKH) motif enrichment in sites from each cluster.
FIG. 2.
FIG. 2.
E2-induced CARM1 activity at ERα sites associates with activating events. (A) Level of recruitment for the coactivators p300 and SRC1 under vehicle (O) or E2 treatment established by ChIP-qPCR on eight ERα sites associated and eight not associated with CARM1 activation in MCF7 breast cancer cells. (B) Levels of histone modifications, namely, H3K18ac, H3K27ac, and H4K12ac, were determined as in panel A. (C) Impact of E2 treatment on nucleosome density. The changes in occupancy of the core histone H3 were determined by ChIP-qPCR as in panel A. Alterations to the DNA accessibility were determined by using FAIRE (21). The results are derived from a minimum of two independent experiments. *, P ≤ 0.05; **, P ≤ 0.01; ***, P ≤ 0.001.
FIG. 3.
FIG. 3.
Clusters associated with CARM1 activation drive the response under E2 treatment. (A) Proportion of E2 upregulated genes compared to nonregulated genes with at least one binding site from a specific cluster within increasing window distances from their TSS in MCF7 cells. *, P ≤ 0.05; **, P ≤ 0.01; ***, P ≤ 0.001. (B) GPER and TESK2 expression after CARM1 silencing in MCF7 was determined by reverse transcription-qPCR and revealed the requirement for CARM1 in the E2-induced repression of GPER and TESK2. siLUC was used as a control. *, P ≤ 0.05; **, P ≤ 0.01; ***, P ≤ 0.001. (C) Enrichment of Ec3 cluster sites (blue blocks) near GPER and TESK2 E2-downregulated target genes (red blocks).
FIG. 4.
FIG. 4.
ERα-positive primary breast tumor expression profile relates to clusters associated with CARM1 activation. Relationship between cluster-associated gene list (genes with a binding site from a given cluster within 20 kb of their TSS) and genes overexpressed in ERα-positive primary breast tumors (the top 1, 5, or 10% overexpressed genes from primary breast tumors were included in the analysis). Twenty independently defined ERα-positive primary breast tumor overexpressing gene signatures (blue) were compared using an Oncomine Concepts Map to the five enhancer clusters (red) derived gene lists. Odds ratios (OR) are presented when clusters are significantly associated with independent primary breast cancer overexpression gene signatures (P ≤ 6e−6).
FIG. 5.
FIG. 5.
Cell-type specific coactivation of ERα binding sites associates with the transcriptional response. (A) Relative expression of PDK4 and FasL genes after E2 treatment for 3 h in MCF7 breast cancer and U2OS/ERα cells. (B) Relative enrichment of ERα and CARM1 activity established by ChIP in both MCF7 and U2OS/ERα cells after E2 treatment at the PDK4 and FasL enhancers.
FIG. 6.
FIG. 6.
Pol II occupied promoter of E2 target genes prior to stimulation. (A) Cluster analysis performed as described for Fig. 1A across the 25,903 promoter regions associated with the RefSeq genes. (B) Proportions of all, E2-upregulated, and downregulated genes with a promoter typical of clusters Pc1prom, Pc2prom, or PcNullprom. (C) Enrichment of E2-downregulated versus nonregulated genes with at least one promoter of the Pc1prom, Pc2prom, or PcNullprom cluster within increasing window distances from the genes' TSS. (D) Specific examples of E2 downregulated genes surrounded by gene with Pol II deprived promoters. Sites from cluster Pc1prom (orange), Pc2prom (pink), or PcNullprom (dark blue) are presented with respect to E2-downregulated genes (red block). (E) Relative chromatin accessibilities of promoters from cluster Pc1prom, Pc2prom, or PcNullprom measured by FAIRE-ChIP. *, P ≤ 0.05; **, P ≤ 0.01; ***, P ≤ 0.001.
FIG. 7.
FIG. 7.
Model for the selection of functional and active enhancer sites in response to estrogen stimulation in breast cancer cells. A schematic representation of the transcriptional response to E2 stimulation in breast cancer cells is shown. The functional association between ERα recruiting sites undergoing coactivator (CoA) recruitment/activation and histone modifications with transcriptional regulation of the gene harboring Pol II at their promoters both prior to and after E2 stimulation is depicted. Sites of ERα recruitment not associated with these secondary events do not significantly impact E2-induced regulation of gene expression.

References

    1. Azuara, V., P. Perry, S. Sauer, M. Spivakov, H. F. Jorgensen, R. M. John, M. Gouti, M. Casanova, G. Warnes, M. Merkenschlager, and A. G. Fisher. 2006. Chromatin signatures of pluripotent cell lines. Nat. Cell Biol. 8532-538. - PubMed
    1. Barski, A., S. Cuddapah, K. Cui, T. Y. Roh, D. E. Schones, Z. Wang, G. Wei, I. Chepelev, and K. Zhao. 2007. High-resolution profiling of histone methylations in the human genome. Cell 129823-837. - PubMed
    1. Bernstein, B. E., T. S. Mikkelsen, X. Xie, M. Kamal, D. J. Huebert, J. Cuff, B. Fry, A. Meissner, M. Wernig, K. Plath, R. Jaenisch, A. Wagschal, R. Feil, S. L. Schreiber, and E. S. Lander. 2006. A bivalent chromatin structure marks key developmental genes in embryonic stem cells. Cell 125315-326. - PubMed
    1. Bild, A. H., G. Yao, J. T. Chang, Q. Wang, A. Potti, D. Chasse, M. B. Joshi, D. Harpole, J. M. Lancaster, A. Berchuck, J. A. Olson, Jr., J. R. Marks, H. K. Dressman, M. West, and J. R. Nevins. 2006. Oncogenic pathway signatures in human cancers as a guide to targeted therapies. Nature 439353-357. - PubMed
    1. Bourdeau, V., J. Deschenes, R. Metivier, Y. Nagai, D. Nguyen, N. Bretschneider, F. Gannon, J. H. White, and S. Mader. 2004. Genome-wide identification of high-affinity estrogen response elements in human and mouse. Mol. Endocrinol. 181411-1427. - PubMed

Publication types