. 2009 May 11;206(5):1029-36.
doi: 10.1084/jem.20082481. Epub 2009 Apr 13.

In vivo regulation of interleukin 1beta in patients with cryopyrin-associated periodic syndromes

Affiliations

In vivo regulation of interleukin 1beta in patients with cryopyrin-associated periodic syndromes

Helen J Lachmann et al. J Exp Med. .

Abstract

The investigation of interleukin 1beta (IL-1beta) in human inflammatory diseases is hampered by the fact that it is virtually undetectable in human plasma. We demonstrate that by administering the anti-human IL-1beta antibody canakinumab (ACZ885) to humans, the resulting formation of IL-1beta-antibody complexes allowed the detection of in vivo-produced IL-1beta. A two-compartment mathematical model was generated that predicted a constitutive production rate of 6 ng/d IL-1beta in healthy subjects. In contrast, patients with cryopyrin-associated periodic syndromes (CAPS), a rare monogenetic disease driven by uncontrolled caspase-1 activity and IL-1 production, produced a mean of 31 ng/d. Treatment with canakinumab not only induced long-lasting complete clinical response but also reduced the production rate of IL-1beta to normal levels within 8 wk of treatment, suggesting that IL-1beta production in these patients was mainly IL-1beta driven. The model further indicated that IL-1beta is the only cytokine driving disease severity and duration of response to canakinumab. A correction for natural IL-1 antagonists was not required to fit the data. Together, the study allowed new insights into the production and regulation of IL-1beta in man. It also indicated that CAPS is entirely mediated by IL-1beta and that canakinumab treatment restores physiological IL-1beta production.


Figures

Figure 1.
Figure 1.
Acute phase response after treatment with canakinumab. (A–E) Data for four patients treated i.v. with 10 mg/kg canakinumab as mean ± SEM. A, SAA and CRP; B, IL-6 and IL-1Ra; C, TNF-α and IL-1α; D, S100 A12 and A8/9; E, soluble IL-1RII (individual data and mean ± SEM). (F) Neutrophil (squares) and lymphocyte (triangle) counts for these patients for the treatment periods at 10 mg/kg i.v. (a), 1 mg/kg i.v. (b), and 150 mg s.c. (c) for treatment days 1 (predose), 2 (24 h after dose), 3 (48 h after dose), and 8 (268 h after dose).
Figure 2.
Figure 2.
Structure of the PK-biomarker-symptom model. (A) canakinumab is injected into the plasma compartment and then permeates and distributes to a peripheral (tissue) compartment, where it can bind IL-1β. Unbound IL-1β in the tissue stimulates production of CRP and SAA and an increased probability of a disease flare. The model was fitted to data from the first four patients for canakinumab pharmacokinetics (B), total IL-1β in plasma (C), and the suppression profile for free IL-1β in the peripheral (black) and central (red, dashed) compartments (D). Also fitted were data for the clinical response (1, flare; 0, remission; E), CRP (F), and SAA (G). Observed data for each patient are shown as colored circles. Straight lines indicate model-derived data. Each of the four MWS patients initially received 10 mg/kg canakinumab i.v., inducing complete clinical remission. After the first relapse, they received 1 mg/kg i.v., followed at each subsequent relapse by 150-mg s.c. injections. Beyond the data, the model was used to predict the effect of an 8-wk regimen of s.c. doses of 150 mg.
Figure 3.
Figure 3.
A prediction check of the model. Simulations were performed for each of the three patients enrolled to the study who were treated only with 150 mg canakinumab injected s.c. Predictions from the model were then compared with the observed data, taking account of their specific bodyweights. Two curves are presented in each case: the dashed line is the prediction check using the parameters that described the data for patients 1–4, and the solid line is that given by the model after adjustment to the new patient. The columns show the comparisons for each patient, with A, D, G, J, and M showing patient 5 and so on for patients 7 and 6. The top row (A–C) compares the model prediction of canakinumab pharmacokinetics with the observed concentrations. The next row (D–F) shows the total captured IL-1β. G–I shows CRP, J–L shows SAA, and the final row (M–O) shows the observed flare (1, flare; 0, remission) overlaid with the model-predicted probability of flare.
Figure 4.
Figure 4.
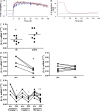
IL-1β production in CAPS patients as compared with healthy controls. (A) Total IL-1β levels in plasma for four CAPS patients (red) and six healthy volunteers (blue) after 10 mg/kg canakinumab i.v. (B) Model-derived estimation of IL-1β production per day in those subjects. (C) Quantitative mRNA expression for IL-1β in whole blood of seven patients and seven healthy subjects before canakinumab treatment. +, P = 0.0498. Horizontal lines indicate means of seven data points. (D) mRNA expression levels for IL-1β in four CAPS patients (left) and seven healthy volunteers (right) at baseline and 24 h after infusion of 10 mg/kg canakinumab. +, P = 0.0144 as compared with baseline (paired Student's t test). (E) mRNA IL-1β expression as a function of doses of 10 mg/kg i.v., 1 mg/kg i.v., and 150 mg s.c. shown for each cycle before dose and 24 h after dose. Note that only four CAPS patients underwent the first two cycles, whereas data show all seven patients for the 150-mg s.c. cycle. +, first cycle, P = 0.0144; *, second cycle, P = 0.0088; **, third cycle, P = 0.0359 (paired Student's t test for 24 h vs. before dose).

References

    1. Dinarello C.A., Renfer L., Wolff S.M. 1977. Human leukocytic pyrogen: purification and development of a radioimmunoassay.Proc. Natl. Acad. Sci. USA. 74:4624–4627 - PMC - PubMed
    1. Dinarello C.A. 2002. The IL-1 family and inflammatory diseases.Clin. Exp. Rheumatol. 20:S1–S13 - PubMed
    1. Veltri S., Smith J.W. 1996. Interleukin 1 trials in cancer patients: a review of the toxicity, antitumor and hematopoietic effects.Stem Cells. 14:164–176 - PubMed
    1. Agostini L., Martinon F., Burns K., McDermott M.F., Hawkins P.N., Tschopp J. 2004. NALP3 forms an IL-1beta-processing inflammasome with increased activity in Muckle-Wells autoinflammatory disorder.Immunity. 20:319–325 - PubMed
    1. Dinarello C.A. 2004. Unraveling the NALP-3/IL-1beta inflammasome: a big lesson from a small mutation.Immunity. 20:243–244 - PubMed

Publication types

MeSH terms