

Channel-like slippage modes in the human anion/proton exchanger ClC-4
- PMID: 19364886
- PMCID: PMC2712972
- DOI: 10.1085/jgp.200810155
Channel-like slippage modes in the human anion/proton exchanger ClC-4
Abstract
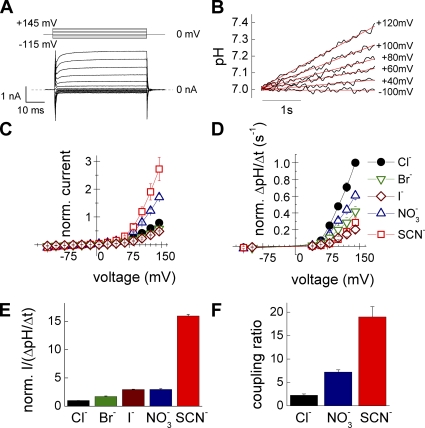
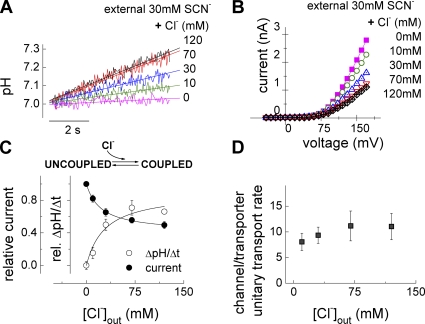
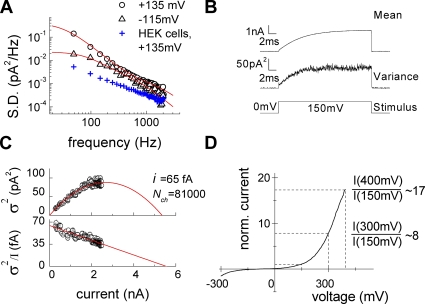
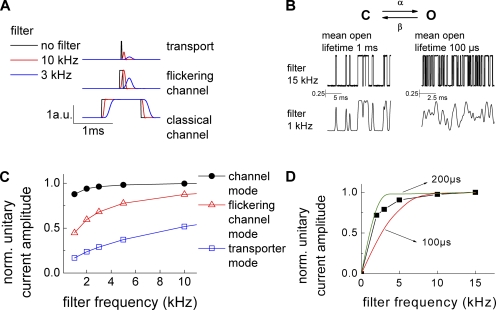
The ClC family encompasses two classes of proteins with distinct transport functions: anion channels and transporters. ClC-type transporters usually mediate secondary active anion-proton exchange. However, under certain conditions they assume slippage mode behavior in which proton and anion transport are uncoupled, resulting in passive anion fluxes without associated proton movements. Here, we use patch clamp and intracellular pH recordings on transfected mammalian cells to characterize exchanger and slippage modes of human ClC-4, a member of the ClC transporter branch. We found that the two transport modes differ in transport mechanisms and transport rates. Nonstationary noise analysis revealed a unitary transport rate of 5 x 10(5) s(-1) at +150 mV for the slippage mode, indicating that ClC-4 functions as channel in this mode. In the exchanger mode, unitary transport rates were 10-fold lower. Both ClC-4 transport modes exhibit voltage-dependent gating, indicating that there are active and non-active states for the exchanger as well as for the slippage mode. ClC-4 can assume both transport modes under all tested conditions, with exchanger/channel ratios determined by the external anion. We propose that binding of transported anions to non-active states causes transition from slippage into exchanger mode. Binding and unbinding of anions is very rapid, and slower transitions of liganded and non-liganded states into active conformations result in a stable distribution between the two transport modes. The proposed mechanism results in anion-dependent conversion of ClC-type exchanger into an anion channel with typical attributes of ClC anion channels.
Figures
 ) and total interpulse (
 ) durations,
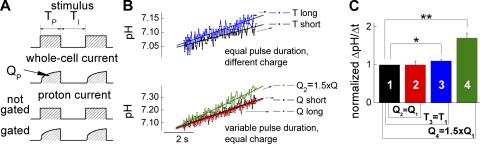
  (Tshort) or
  (Tlong), respectively. The bottom panel compares intracellular alkalinization elicited by protocols that differ in total pulse (
 ) and total interpulse (
 ) durations but exhibit equal total transported charge (
 ). For “Q short,” TP and TI equal 1.5 ms, whereas “Q long” denotes a pulse protocol with
  and
and  In the protocol “Q2 = 1.5 QT,”
  and
and  resulting in total transported charge,
  which is 1.5 times larger compared with pulse protocols “Q short” and “Q long.” (C) Statistical analysis of pH responses in several cells (n = 4–6).
References
-
- Accardi A., Miller C. 2004. Secondary active transport mediated by a prokaryotic homologue of ClC Cl− channels.Nature. 427:803–807 - PubMed
-
- Accardi A., Lobet S., Williams C., Miller C., Dutzler R. 2006. Synergism between halide binding and proton transport in a CLC-type exchanger.J. Mol. Biol. 362:691–699 - PubMed
-
- Alekov A.K., Fahlke C. 2008. Anion channels: regulation of ClC-3 by an orphan second messenger.Curr. Biol. 18:R1061–R1064 - PubMed
-
- Barry P.H. 1994. JPCalc, a software package for calculating liquid junction potential corrections in patch-clamp, intracellular, epithelial and bilayer measurements and for correcting junction potential measurements.J. Neurosci. Methods. 51:107–116 - PubMed
Publication types
MeSH terms
Substances
LinkOut - more resources
Full Text Sources
Molecular Biology Databases
