Clinical Trial
. 2009 Apr;66(4):471-9.
doi: 10.1001/archneurol.2009.16.

Regulatory T cells are reduced during anti-CD25 antibody treatment of multiple sclerosis

Affiliations
Clinical Trial

Regulatory T cells are reduced during anti-CD25 antibody treatment of multiple sclerosis

Unsong Oh et al. Arch Neurol. 2009 Apr.

Abstract

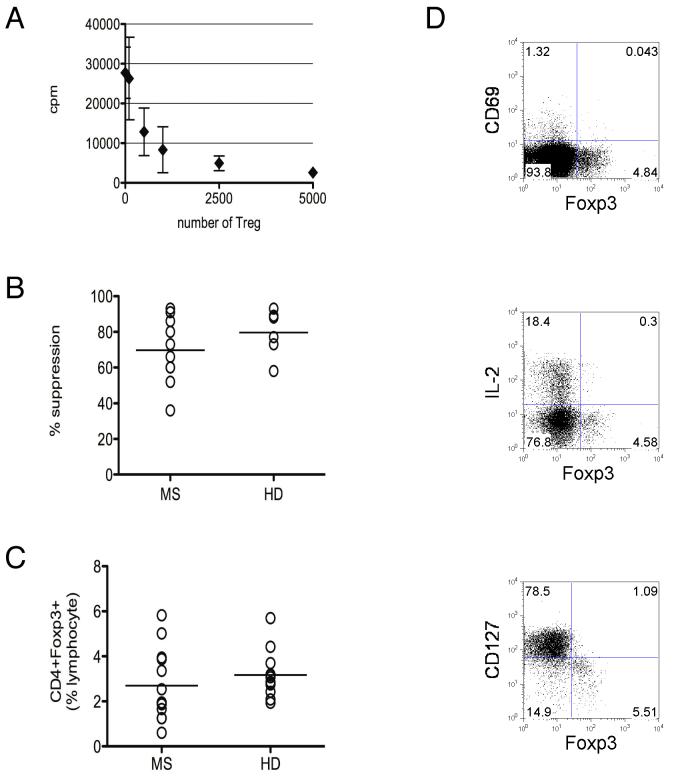
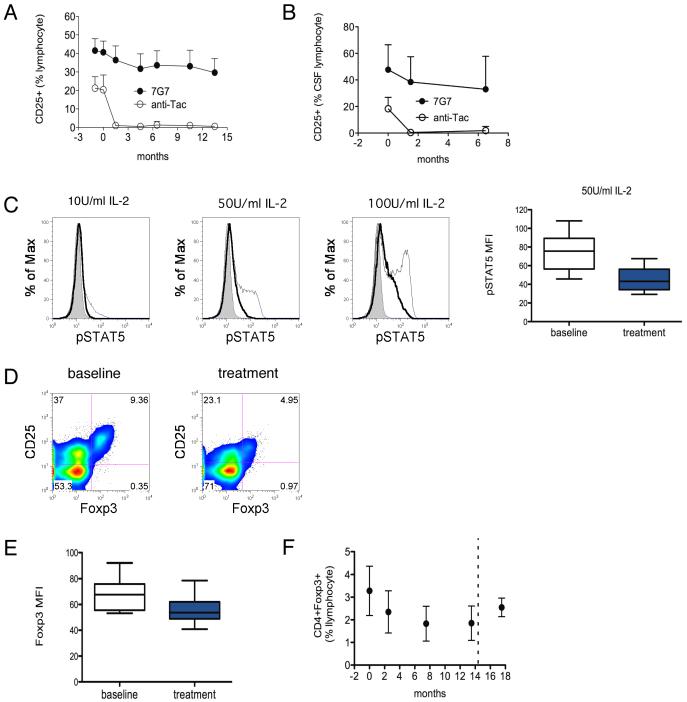
Objective: Maintenance therapy with anti-CD25 antibody has emerged as a potentially useful treatment for multiple sclerosis (MS). Constitutive CD25 expression on CD4+CD25+ regulatory T cells (Treg) suggests that anti-CD25 antibody treatment may potentially target a subset of T cells that exhibit immune suppressive properties. We examined changes to CD4+CD25+ Treg in patients with MS receiving maintenance anti-CD25 monoclonal antibody treatment to determine the effect of treatment on Treg and, consequently, on immunological tolerance.

Design: Peripheral blood and cerebrospinal fluid samples obtained from a before-and-after trial of anti-CD25 antibody monotherapy were examined to compare baseline and treatment differences in CD4+CD25+ Treg.

Subjects: A total of 15 subjects with MS. One subject was withdrawn owing to an adverse effect.

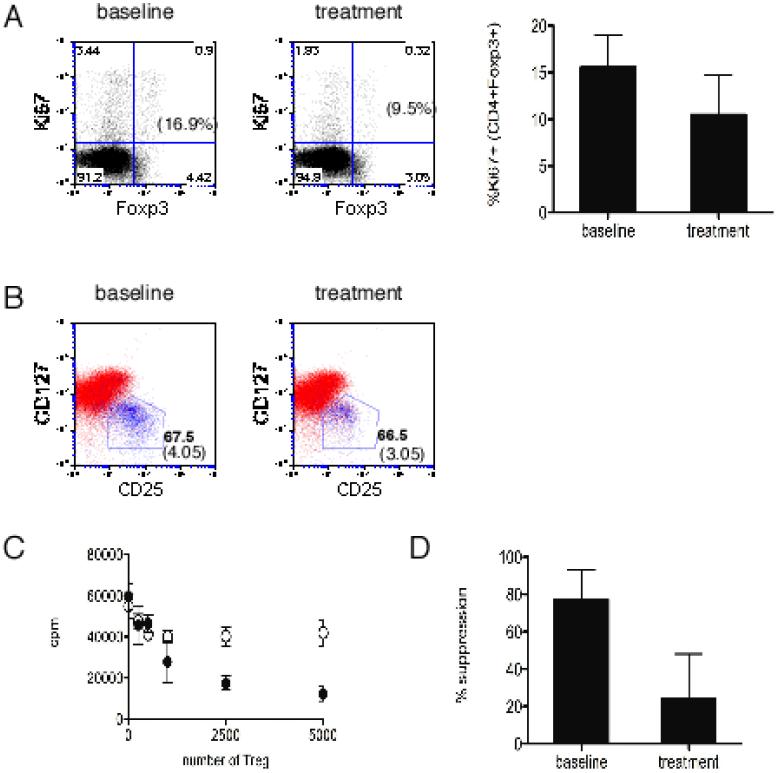
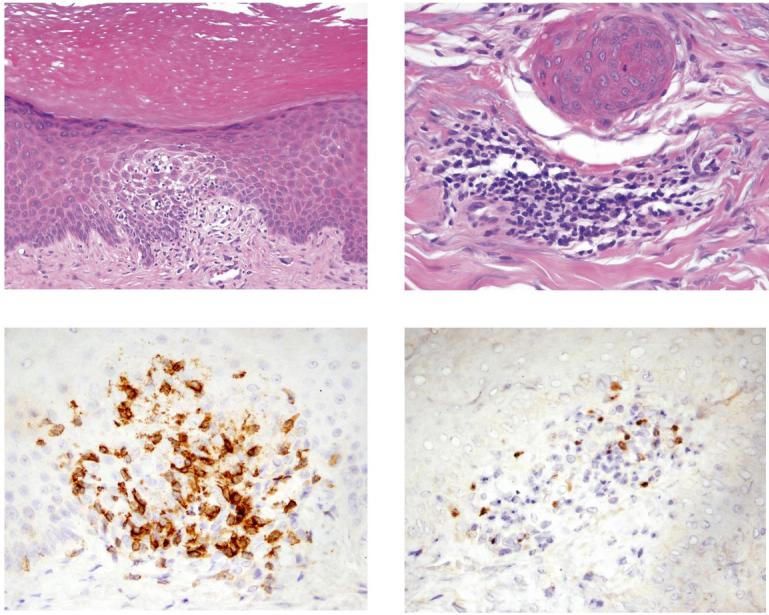
Results: Sustained reduction of the frequency of CD4+CD25+ Treg was observed during treatment. Anti-CD25 antibody treatment led to evidence of impaired in vivo Treg proliferation and impaired ex vivo Treg suppression. Inflammatory MS activity was substantially reduced with treatment despite reduction of circulating Treg, and there was no correlation between changes in the frequency of Treg and changes in brain inflammatory activity. However, new-onset inflammatory disease, notably dermatitis, was also observed in a number of subjects during treatment.

Conclusion: The reduction in Treg did not negatively affect maintenance of central nervous system tolerance during anti-CD25 antibody treatment. The incidence of new-onset inflammatory disease outside of the central nervous system in a subset of patients, however, warrants further studies to examine the possibility of compartmental differences in the capacity to maintain tolerance in the setting of reduced CD4+CD25+ Treg.


Figures

Figure 1
Figure 1. Baseline Treg characteristics in subjects with multiple sclerosis
A Representative Treg coculture assay [3H] thymidine incorporation data (mean cpm ± standard deviation) showing dose dependent Treg suppression for a subject with MS (86% suppression). Up to 5×10³ FACS sorted CD4+CD25high (Treg) cells were titrated in coculture with 5×10³ CD4+CD25- (responder) cells for 5-day stimulation with anti-CD3 antibody as described in Methods. B Baseline Treg suppression in subjects with multiple sclerosis “MS” (mean 69.7±18%) compared to healthy donors “HD” (mean 79.7 ± 13%; p = 0.266). C Frequency of peripheral blood CD4+Foxp3+ cells from subjects with MS (mean 2.7 ± 1.6% of lymphocytes) compared to age, race and gender-matched healthy donors (mean 3.2 ± 1.0% of lymphocytes; p = 0.372). D Representative CD4+ gated FACS plots from a subject with MS showing negative CD69 and low or negative CD127 expression in Foxp3+ cells (data representative of 6 MS and 3 healthy donors), and attenuation of IL-2 production following 6 hr PMA/ionomycin stimulation (data representative of 4 MS and 3 healthy donors).
Figure 2
Figure 2. Reduction in Treg during anti-CD25 antibody treatment
A Anti-CD25 antibody saturation and total CD25 expression on lymphocytes over time. Antibody saturation and CD25 expression were evaluated by FACS analysis of whole blood using two fluorochrome-labeled antibodies (anti-Tac and 7G7) directed at non-competing epitopes on CD25. Complete antibody saturation of CD25 was demonstrated by lack of fluorochrome-labeled anti-Tac binding. Total CD25 expression (7G7) declined by 13% (p<0.0001 repeated measures ANOVA; n = 12) Months 0 and 0.5 represent the first two infusions. Monthly administration followed thereafter with month13.5 representing the final infusion. B Antibody saturation (anti-Tac) and CD25 expression (7G7) in CSF lymphocytes over time (p = 0.0384; n = 10). C Histograms show representative STAT5 phosphorylation in PBMC obtained during anti-CD25 antibody treatment (bold line) compared to baseline (thin line) and control (shaded) following 15 minute ex vivo IL-2 exposure. Box plot compares STAT5 phosphorylation during treatment (shaded box) compared to baseline (empty box) (p = 0.0050; n = 7). D Representative CD4+ gated FACS analysis of CD4+CD25+Foxp3- conventional activated T cells (upper left quadrants) and CD4+CD25+Foxp3+ Treg (upper right quadrants) at baseline and during treatment. E Reduced Foxp3 MFI (mean fluorescence intensity) during treatment (shaded box) compared to baseline (empty box; p = 0.0007; n = 12). F Reduction in frequency of CD4+Foxp3+ cells (% lymphocyte) over time during the course of anti-CD25 antibody treatment (p<0.0001 repeated measures ANOVA; n = 12). Dashed line indicates end of treatment
Figure 3
Figure 3. Treg in vivo proliferation and ex vivo suppression are impaired during anti-CD25 antibody treatment
A Representative FACS analysis comparing Ki67 expression in Foxp3+ cells at baseline and during anti-CD25 antibody treatment (% Ki67 expressing fraction in parentheses). Bar graph compares proportion of CD4+Foxp3+ cells expressing Ki67 (mean +/- standard deviation) at baseline and during treatment (p = 0.0010; n = 12). B Representative CD4+ gated FACS analysis showing that majority of CD4+Foxp3+ cells (blue) are CD25+CD127low/neg (polygonal gate) at baseline and remain CD25+CD127low/neg during treatment. Numbers indicate the frequency of cells that are Foxp3+ within the polygonal gate and, in parentheses, the frequency of total CD4+Foxp3+ cells (% lymphocytes). C Representative [3H] Thymidine incorporation data (mean cpm ± standard deviation) shown for up to 5×10³ FACS sorted Treg (CD4+CD25+CD127low/neg) titrated in coculture with 5×10³ responder (CD4+CD25-CD127+) cells. Closed circles represent cells from baseline and open circles represent cells obtained during anti-CD25 antibody treatment. D Reduced suppressive capacity (mean % suppression +/- standard deviation) of circulating Treg during anti-CD25 antibody treatment (p = 0.0284; n = 4).
Figure 4
Figure 4. Lack of correlation between reduction in the frequency of Treg and changes in acute CNS inflammatory activity
A Reduction in brain inflammatory activity indicated by reduction in the total number of contrast enhancing MS lesions per month (total # of Gd-DTPA lesions) on serial brain magnetic resonance images (p = 0.0006; n = 13). B Regression analysis of correlation between change in total number of contrast enhancing lesions per month (% reduction in Gd-DTPA+ lesions) and change in the frequency of circulating Treg (% reduction in # of Treg) at month 7.5 during anti-CD25 antibody treatment (r2 = 0.0171; p=0.685). Pearson correlation coefficient. Analysis of Treg in lesional skin. C Hematoxylin and Eosin (H&E) stained tissue section (subject MS9) showing epidermal changes of the skin lesion, characterized by compact hyperkeratosis, acanthosis and focal spongiosis with exocytosis of lymphocytes (20x). D H&E stained section showing histologic changes in the superficial dermis, characterized by a perivascular chronic inflammatory infiltrate comprised predominantly of lymphocytes. E Immunohistochemical staining for CD3. F Immunohistochemical staining for Foxp3.

References

    1. Waldmann TA. The IL-2/IL-2 receptor system: a target for rational immune intervention. Immunol Today. 1993;14:264–270. - PubMed
    1. Zhang J, Markovic-Plese S, Lacet B, et al. Increased frequency of interleukin 2-responsive T cells specific for myelin basic protein and proteolipid protein in peripheral blood and cerebrospinal fluid of patients with multiple sclerosis. J Exp Med. 1994;179:973–984. - PMC - PubMed
    1. Bielekova B, Richert N, Howard T, et al. Humanized anti-CD25 (daclizumab) inhibits disease activity in multiple sclerosis patients failing to respond to interferon beta. Proc Natl Acad Sci U S A. 2004;101:8705–8708. - PMC - PubMed
    1. Rose JW, Burns JB, Bjorklund J, et al. Daclizumab phase II trial in relapsing and remitting multiple sclerosis: MRI and clinical results. Neurology. 2007;69:785–789. - PubMed
    1. Sakaguchi S. Naturally arising CD4+ regulatory t cells for immunologic self-tolerance and negative control of immune responses. Annu Rev Immunol. 2004;22:531–562. - PubMed

Publication types

MeSH terms