. 2009 May 5;106(18):7485-90.
doi: 10.1073/pnas.0811944106. Epub 2009 Apr 13.

A right-sided pathway involving FGF8/Snai1 controls asymmetric development of the proepicardium in the chick embryo

Affiliations

A right-sided pathway involving FGF8/Snai1 controls asymmetric development of the proepicardium in the chick embryo

Jan Schlueter et al. Proc Natl Acad Sci U S A. .

Abstract

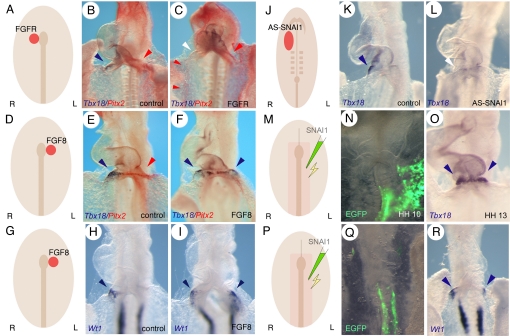
The proepicardium (PE) is a transient structure that forms at the venous pole of the embryonic vertebrate heart. This cardiac progenitor cell population gives rise to the epicardium, coronary vasculature, and fibroblasts. In the chicken embryo, the PE displays left-right (L-R) asymmetry and develops only on the right side, while on the left only a vestigial PE is formed, which subsequently gets lost by apoptosis. In this study, we analyzed how the L-R asymmetry pathway affects PE formation. Experimental manipulation of left-side determinants such as Shh, Nodal, and Cfc as well as forced expression of Pitx2 had no effect on the sidedness of PE development. In contrast, inhibition of early-acting regulators of L-R axis formation such as H(+)/K(+)-ATPase or primitive streak apoptosis affected the sidedness of PE development. Experimental interference with the right-side determinants Fgf8 or Snai1 prevented PE formation, whereas ectopic left-sided expression of Fgf8 or Snai1 resulted in bilateral PE development. These data provide novel insight into the molecular control of asymmetric morphogenesis suggesting that also the right side harbors an instructive signaling pathway that is involved in the control of PE development. This pathway might be of general relevance for setting up L-R asymmetries at the venous pole of the heart.


Conflict of interest statement

The authors declare no conflict of interest.

Figures

Fig. 1.
Fig. 1.
Misexpression of Shh, Nodal, and Pitx2 on the right side does not affect sidedness of Tbx18 expression. (A, E, and I) Schematic depiction of the site of implantation of (A) Shh-expressing cells, (E) beads soaked in Nodal protein, or (I) Pluronic gel containing antisense Cfc oligonucleotides. Embryos were cultured until HH stage 12/13 and subjected to whole mount in situ hybridization analysis of (B-D, J, K, and P) Pitx2 (red color) and Tbx18 (blue color) expression. Red and blue arrowheads point to Pitx2 and Tbx18 expression domains, respectively. Only the heart region is shown in a ventral view, anterior end up. Embryos were treated on the right side of Hensen's node at HH stage 4 with (B-D) Shh-expressing cells, or (J and K) Cfc antisense oligonucleotides. (F and G) Whole mount in situ hybridization analysis of Nodal expression in HH stage 8 embryos after (F) control treatment or (G) implantation of Nodal protein at HH stage 6/7. (H) Tbx18 expression in a Nodal-treated embryo cultured until HH stage 12. (L) Proportion (%) of experimental embryos displaying aberrant Tbx18 or Nodal expression domains subsequent to Shh, Nodal, or antisense CFC treatment. Red bars indicate the percentage of embryos with aberrant Pitx2 expression, and yellow bars indicate the amount of normal left-sided expression. In the case of Nodal implantation, Nodal expression within LPM was analyzed. Blue bars display percentage of embryos with right-sided Tbx18 expression. (M-P) Electroporation of eGFP and Pitx2-RCAS constructs. (M-O) GFP fluorescent signal of an electroporated embryo at (M) HH stage 4, (N) HH stage 7, and (O) HH stage 12. (P) Forced expression of Pitx2 did not affect Tbx18 expression in the right sinus horn.
Fig. 2.
Fig. 2.
Inhibitors of H+/K+-ATPase and apoptosis randomizes laterality of proepicardial Tbx18 expression. (A-D) Whole mount in situ hybridization analysis of Pitx2 (red color) and Tbx18 (blue color) expression in cultured embryos that were treated with omeprazole. Only the heart region is shown in a ventral view, anterior end up. (A) Embryo with right-sided Tbx18 and left-sided Pitx2 expression domains. (B) Embryo with left-sided Tbx18 and right-sided Pitx2 expression domains. (C) Embryo with bilateral Pitx2 and loss of Tbx18. (D) Embryo with bilateral Tbx18 expression domains and loss of Pitx2. Red and blue arrowheads point to the Pitx2 and Tbx18 expression domains, respectively. (E-H) Fluorescent in situ hybridization of Tbx18 in embryos that were treated with the apoptosis inhibitor Z-VAD-FMK and cultured until HH stage 15. The inflow tract region of (E) control, and (G) inhibitor-treated embryo are shown. Green and red arrowheads point to PE anlagen with right or left identity, respectively. (F and H) 3D reconstructions of the Tbx18 expression domains in the inflow tract region shown in (E and G).
Fig. 3.
Fig. 3.
FGF8 and Snai1 are essential for right-sided PE development. (A, D, G, J, M, and P) Schematic depiction of the experiments. (B, E, H, and K) are controls and (C, F, I, L, N, O, Q, and R) experimental embryos. Only the heart region is shown in a ventral view, anterior end up of embryos subjected to whole mount in situ hybridization analysis of (B, C, E, and F) Pitx2 (red color) and Tbx18 (blue color), (H, I, R) Wt1, or (K, L, O) Tbx18 expression. (N and Q) GFP signal of electroporated embryos. (A-C) Embryos implanted with an aggregate of FGFR-expressing cells to the right of Hensen's node. (D-I) Embryos implanted with beads soaked in FGF8 protein to the left of Hensen's node. (J-L) Embryos treated with (K) control or (L) antisense Snai1 oligonucleotides. (M-R) Embryos electroporated with Snai1 and eGFP encoding plasmids. Blue arrowheads point to the endogenous and ectopic Tbx18 or Wt1 expression domains. Red arrowheads point to the endogenous and ectopic Pitx2 expression domains. White arrowheads in (C and L) point to the loss of endogenous Tbx18 expression.
Fig. 4.
Fig. 4.
Model of the molecular pathway that controls asymmetric PE development. In the early gastrulating chicken embryo a functional midline is established that divides the left from the right side (red line). Endogenous H+/K+-ATPase-dependent difference in membrane voltage potential exists between the left (−) and right (+) sides of the primitive streak. In the midline, cells are fated to undergo apoptosis (green bar). At HH stages 4–6, asymmetric gene expression within Hensen's node is established leading to the induction of the Nodal-Pitx2 pathway on the left side, while FGF8 induces Snai1 on the right. The Nodal-Pitx2 pathway on the left side has no effect on PE-specific marker gene expression. In contrast, Snai1 on the right side is required for Tbx18 and Wt1 expression.

Similar articles

Cited by

References

    1. Raya A, Belmonte JC. Left-right asymmetry in the vertebrate embryo: From early information to higher-level integration. Nat Rev Genet. 2006;7:283–293. - PubMed
    1. Schlueter J, Brand T. Left-right axis development: Examples of similar and divergent strategies to generate asymmetric morphogenesis in chick and mouse embryos. Cytogenet Genome Res. 2007;117:256–267. - PubMed
    1. Lopez-Gracia ML, Ros MA. Left-right asymmetry in vertebrate development. Adv Anat Embryol Cell Biol. 2007;188:1–121. - PubMed
    1. Levin M, et al. Asymmetries in H+/K+-ATPase and cell membrane potentials comprise a very early step in left-right patterning. Cell. 2002;111:77–89. - PubMed
    1. Levin M, Palmer AR. Left-right patterning from the inside out: Widespread evidence for intracellular control. BioEssays. 2007;29:271–287. - PubMed

Publication types

MeSH terms