. 2009 May 19;106(20):8093-100.
doi: 10.1073/pnas.0902192106. Epub 2009 Apr 13.

History of Animals using Isotope Records (HAIR): a 6-year dietary history of one family of African elephants

Affiliations

History of Animals using Isotope Records (HAIR): a 6-year dietary history of one family of African elephants

Thure E Cerling et al. Proc Natl Acad Sci U S A. .

Abstract

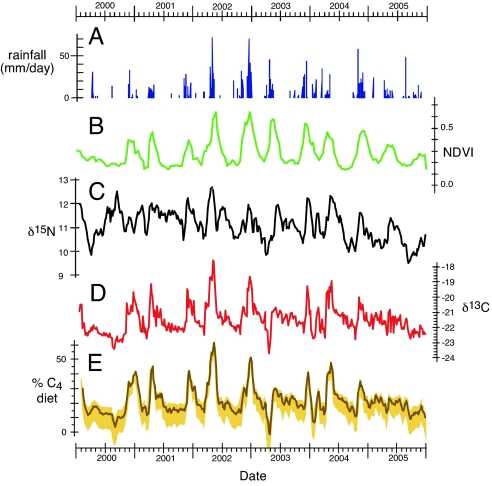
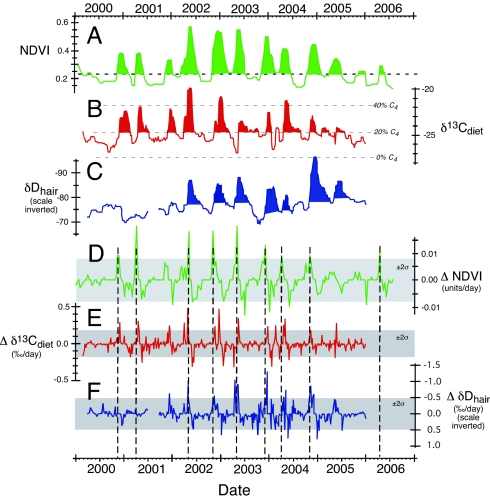
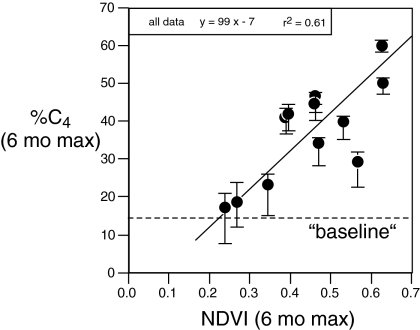
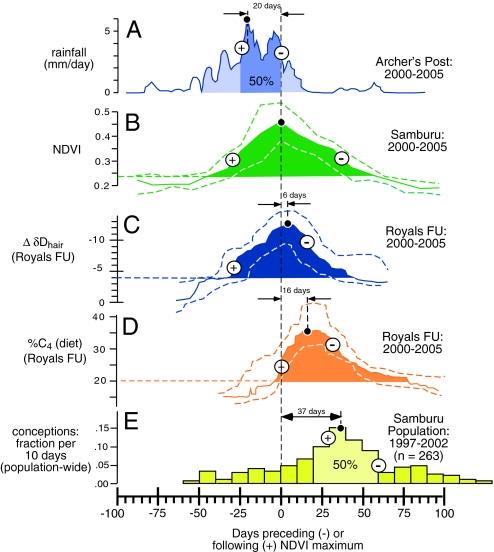
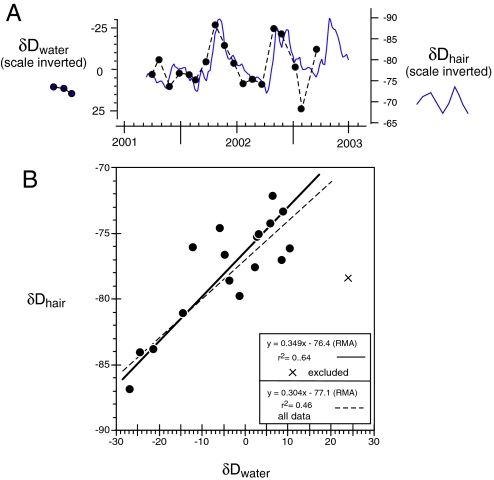
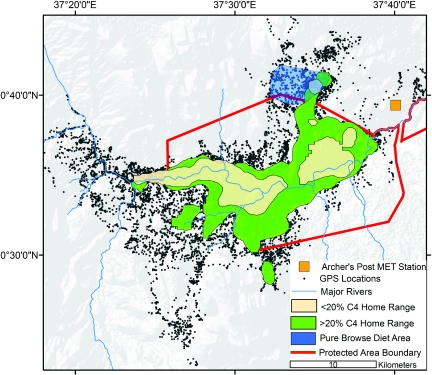
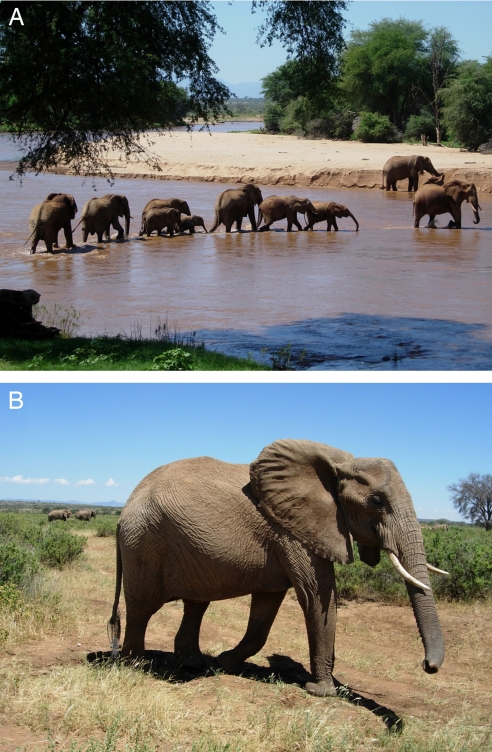
The dietary and movement history of individual animals can be studied using stable isotope records in animal tissues, providing insight into long-term ecological dynamics and a species niche. We provide a 6-year history of elephant diet by examining tail hair collected from 4 elephants in the same social family unit in northern Kenya. Sequential measurements of carbon, nitrogen, and hydrogen isotope rations in hair provide a weekly record of diet and water resources. Carbon isotope ratios were well correlated with satellite-based measurements of the normalized difference vegetation index (NDVI) of the region occupied by the elephants as recorded by the global positioning system (GPS) movement record; the absolute amount of C(4) grass consumption is well correlated with the maximum value of NDVI during individual wet seasons. Changes in hydrogen isotope ratios coincided very closely in time with seasonal fluctuations in rainfall and NDVI whereas diet shifts to relatively high proportions of grass lagged seasonal increases in NDVI by approximately 2 weeks. The peak probability of conception in the population occurred approximately 3 weeks after peak grazing. Spatial and temporal patterns of resource use show that the only period of pure browsing by the focal elephants was located in an over-grazed, communally managed region outside the protected area. The ability to extract time-specific longitudinal records on animal diets, and therefore the ecological history of an organism and its environment, provides an avenue for understanding the impact of climate dynamics and land-use change on animal foraging behavior and habitat relations.


Conflict of interest statement

The authors declare no conflict of interest.

Figures

Fig. 1.
Fig. 1.
Nitrogen and carbon isotope data and the estimated percentage of C4 biomass in diet derived from the composite hair profile demonstrate seasonal oscillations matching fluctuations in rainfall and NDVI from the Samburu region. (A) Rainfall from Archer's Post. (B) NDVI of Samburu region. (C) δ15N of composite hair profile. (D) δ13C of composite hair profile. (E) Estimated percentage of C4 biomass in the diet (3-point running average). The solid line is using the model as described in Methods, and the C3 and C4 end-member values of −27.4 and −13.4‰, respectively. Shaded envelope gives ranges encompassed by seasonal end-member C3 and C4 values of −28.5‰ and −12‰ (wet season top of envelope), respectively, and −26‰ and −14‰ (dry season bottom of envelope), respectively.
Fig. 2.
Fig. 2.
Median values for NDVI, δ13Cdiet, and δDhair. All values are ≈1 month medians. (A) Median values of NDVI. (B) Median values of δ13C in diet. (C) median values of δD in hair (scale inverted). (D) First derivative of NDVI record: ΔNDVI (units are NDVI/day). (E) First derivative of δ13C record: Δδ13C (units are ‰/day). (F) First derivative of δD of hair: ΔδD (units are ‰/day). (D–F) Shaded horizontal boxes show ± 2σ for ΔNDVI, Δδ13C, and ΔδD; dashed vertical lines show the maximum values (> 2σ) for ΔNDVI.
Fig. 3.
Fig. 3.
Correlation between maximum NDVI and maximum percentage of C4 biomass calculated in diet for 6-month time intervals from 2001 to 2006; reduced major axis (RMA) used to calculate regression. Time intervals were from 1 March to 1 September and from 1 September to 1 March, so as to differentiate the “long” and “short” rains, respectively (usually April–May and November–December). The solid line is for all data and vertical bars show the total range of calculated diets, using the 3 end-member mixing values discussed in Diet history of Royals Family.
Fig. 4.
Fig. 4.
Isotopic chronologies derived from elephant tail hairs demonstrate that isotopic shifts related to water resources and diet (C3 browse versus C4 grass) were synchronized with seasonal rainfall pulses and their impact on vegetation (here measured as NDVI). The average timing of the initiation (begin shaded area), maximum increase (+), peak values (black circle), maximum decrease (−), and end of each peak (end of shaded area) for: mean (5-day average) daily rainfall (A); median NDVI (B); median ΔδD (C); median δ13C (D); and conceptions (E). All are referenced to the maximum NDVI value, and dashed lines show the 25th and 75th percentiles.
Fig. 5.
Fig. 5.
Relationships between the isotope composition of local water and hair. (A) δD values for elephant hair and for water collected from the Ewaso N′giro at Samburu Reserve for 18 months from October 2001 through March 2003. The value for the elephant hair is a ≈15-day average (3-point mean) centered on the day of the water collection (± 3 days). (B) Correlation between δD values of elephant hair and water from the Ewaso N′giro River (as in 6A). Lines are for Reduced Major Axis regression (52, 53).
Fig. 6.
Fig. 6.
Regional map displaying GPS positions (black dots) collected from M4 and M5 in and around the national reserves (red polygon overlayed on a digital elevation map) during the 6-year study. The 95% kernel home range (42) retracted to areas in close proximity of the permanent Ewaso N′giro river (blue line) during dry season periods when diets were <20% grass (beige polygon), whereas ranges expanded to regions further from the river as the proportion of grass increased (green polygon). The only period when diets were 100% browse (blue polygon) occurred north of the protected area boundary in a heavily grazed community conservation region.
Fig. 7.
Fig. 7.
(A) Elephant family crossing the Ewaso N′giro in Samburu and Buffalo Springs Reserve (photo by M. Kephart). (B) Elephant with tail hair typical of that used in this study.

References

    1. Stearns SC. The Evolution of Life Histories. Oxford: Oxford Univ Press; 1992.
    1. Ostfeld RS, Keesing F. Pulsed resources and community dynamics of consumers in terrestrial ecosystems. Trends Ecol Evol. 2000;15:232–237. - PubMed
    1. Yang LH, Bastow JL, Spence KO, Wright AN. What can we learn from resource pulses? Ecology. 2008;86:621–634. - PubMed
    1. Talbot LM. Food preferences of some East African wild ungulates. East African Agri Forest J. 1962;27:131–138.
    1. Field CR. The food habits of wild ungulates in Uganada by analysis of stomach contents. East African Wildlife J. 1972;10:17–42.

Publication types