. 2009 Jul 9;114(2):346-56.
doi: 10.1182/blood-2008-12-191296. Epub 2009 Apr 13.

IL-10 is up-regulated in multiple cell types during viremic HIV infection and reversibly inhibits virus-specific T cells

Affiliations

IL-10 is up-regulated in multiple cell types during viremic HIV infection and reversibly inhibits virus-specific T cells

Mark A Brockman et al. Blood. .

Abstract

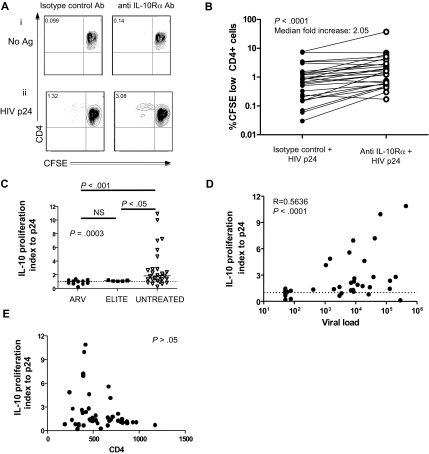
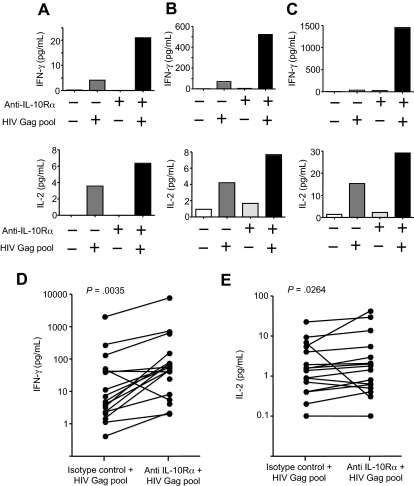
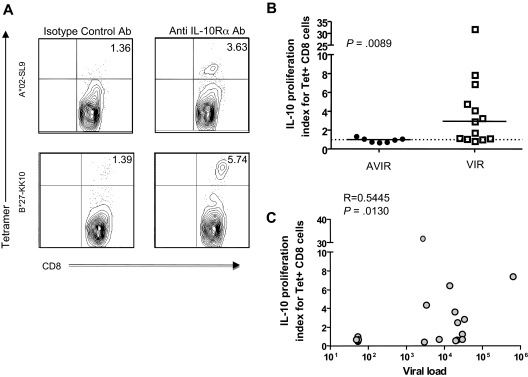
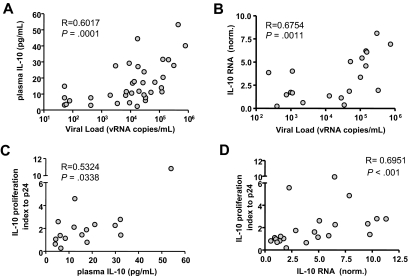
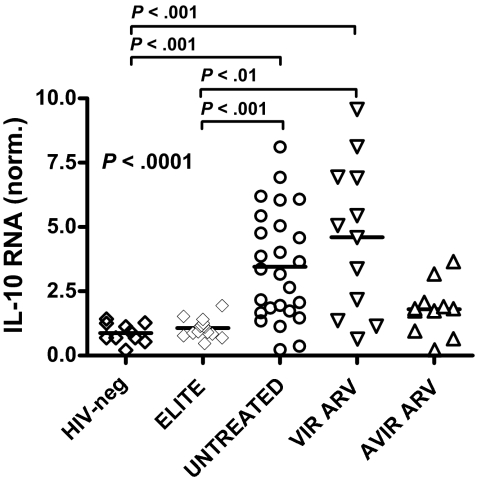
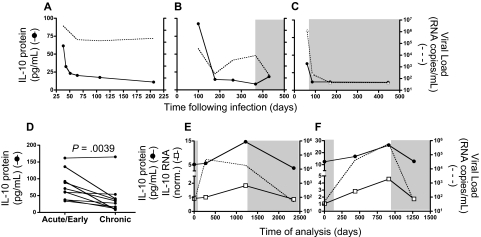
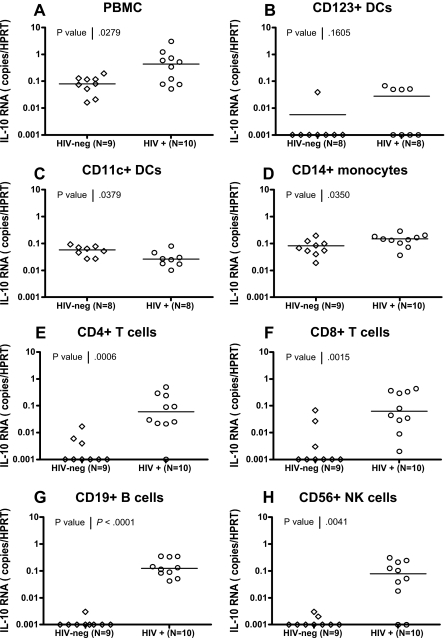
Murine models indicate that interleukin-10 (IL-10) can suppress viral clearance, and interventional blockade of IL-10 activity has been proposed to enhance immunity in chronic viral infections. Increased IL-10 levels have been observed during HIV infection and IL-10 blockade has been shown to enhance T-cell function in some HIV-infected subjects. However, the categories of individuals in whom the IL-10 pathway is up-regulated are poorly defined, and the cellular sources of IL-10 in these subjects remain to be determined. Here we report that blockade of the IL-10 pathway augmented in vitro proliferative capacity of HIV-specific CD4 and CD8 T cells in individuals with ongoing viral replication. IL-10 blockade also increased cytokine secretion by HIV-specific CD4 T cells. Spontaneous IL-10 expression, measured as either plasma IL-10 protein or IL-10 mRNA in peripheral blood mononuclear cells (PBMCs), correlated positively with viral load and diminished after successful antiretroviral therapy. IL-10 mRNA levels were up-regulated in multiple PBMC subsets in HIV-infected subjects compared with HIV-negative controls, particularly in T, B, and natural killer (NK) cells, whereas monocytes were a major source of IL-10 mRNA in HIV-infected and -uninfected individuals. These data indicate that multiple cell types contribute to IL-10-mediated immune suppression in the presence of uncontrolled HIV viremia.


Figures

Figure 1
Figure 1
IL-10Rα blockade restores HIV-specific CD4 T-cell function in individuals with uncontrolled viremia. (A) CD4 T-cell proliferation was measured by flow cytometry of CFSE-labeled CD8 T cell–depleted PBMCs incubated with no antigen or HIV p24, plus isotype control antibody or IL-10Rα antibody. Numbers in upper left quadrants indicate the percentage of CD3+CD4+CFSElow cells in each condition. Blockade of the IL-10 pathway significantly increased proliferation of p24 antigen–specific CD4 T cells, as shown in this representative sample. (B) Statistical analysis of CFSE results obtained in a cohort of 27 viremic subjects with chronic untreated infection (P < .001; Wilcoxon-matched pairs test). (C) Statistical comparison of impact of IL-10Rα blockade on HIV p24–specific CD4 T-cell proliferation in chronically HIV-infected subjects with viral loads suppressed to less than 50 RNA copies by antiretroviral therapy (ARV; n = 9), elite controllers (ELITE; n = 6), and chronically infected individuals with viral load of greater than 1000 RNA copies/mm3 (UNTREATED; n = 24) suggested a significant difference among groups (P = .001; Kruskall Wallis test, followed by Dunn posttest for paired comparisons). The vertical axis (IL-10 proliferation index) corresponds to the ratio of the fraction of proliferating (%CD3+CD4+CFSElow) cells in the presence of the IL-10Rα blocking antibody versus isotype control. Short horizontal bars indicate median proliferation index. (D,E) Statistical analysis of data on untreated subjects in panel C (elite controllers and chronic untreated subjects) indicated a significant correlation between viral load (R = 0.5636; P < .001) in panel D, but not CD4 count (P > .05; E) with the effect of IL-10Rα blockade on HIV-specific CD4 T-cell proliferation (Spearman rank sum test).
Figure 2
Figure 2
IL-10-Rα blockade enhances cytokine secretion by HIV-specific CD4+ T cells. (A-C) Cytokine secretion by HIV-specific CD4 T-cell proliferation was measured by multiplex immunoassay in supernatants of CD8 T cell–depleted PBMCs incubated with no antigen or an HIV Gag peptide pool, plus isotype control antibody or IL-10Rα antibody. Blockade of the IL-10 pathway increased IFN-γ and IL-2 cytokine secretion by HIV-specific CD4 T cells, as shown in these 3 representative subjects. (D-E) Statistical analysis of data on 14 untreated subjects indicated a significant increase of both IFN-γ (P = .004; D) and IL-2 (P = .026; E) in the presence of IL-10Rα blockade (Wilcoxon matched pairs test).
Figure 3
Figure 3
IL-10Rα blockade restores HIV-specific CTL function in individuals with uncontrolled viremia. (A) Flow cytometry was used to assess proliferation of HIV-specific HLA class I tetramer–labeled CD8 T cells from 2 subjects incubated with the cognate HIV epitope, plus isotype control antibody or IL-10Rα blocking antibody. Representative data from 2 subjects is shown. Numbers in upper right quadrants indicate the percentage of CD3+CD8+Tetramerhigh cells for each condition. (B) Statistical comparison of impact of IL-10Rα blockade on HIV p24–specific Tet+ CD8 T-cell proliferation in chronically HIV-infected subjects with undetectable viral loads (AVIR; n = 7), and chronically infected individuals with viral loads of greater than 1000 RNA copies/mm3 (VIR; n = 13) demonstrated a significant difference between these groups (P = .009; Mann-Whitney U test). The vertical axis (IL-10 proliferation index) corresponds to the ratio of the fraction of Tet+ cells (%CD3+CD8+Tethigh) cells in the presence of the IL-10Rα blocking antibody versus isotype control. Short horizontal bars indicate median proliferation index. (C) Statistical analysis of the data on subjects in panel B indicated a significant correlation between untreated viral load and the effect of IL-10Rα blockade on HIV-specific CD8 T-cell proliferation (R = 0.5445, P = .013; Spearman rank sum test).
Figure 4
Figure 4
IL-10 expression correlates with HIV viremia and response to IL-10Rα blockade. The level of IL-10 protein in plasma and mRNA expression in bulk PBMCs were examined in 35 untreated HIV+ individuals. IL-10 protein concentration (A) and IL-10 mRNA expression values (B) correlated significantly with plasma viral load measurements (R = 0.6017 and R = 0.6754, respectively). Next, the impact of IL-10Rα blockade on HIV p24–specific CD4 T cells was correlated with IL-10 protein or mRNA results. The IL-10 proliferation index, defined as the ratio of the fraction of proliferating (%CD3+CD4+CFSElow) cells in the presence of the IL-10Rα blocking antibody versus isotype control, indicated a significant correlation between an individual's responsiveness to IL-10 pathway blockade and both plasma IL-10 protein (R = 0.5324, P = .034) (C) or PBMC IL-10 mRNA (R = 0.6951, P < .001). (D) Correlation coefficients suggest that IL-10 mRNA expression in PBMCs is a better predictor of response to IL-10 blockade than plasma IL-10 protein concentration. All statistical analyses used the Spearman rank sum test.
Figure 5
Figure 5
Relationships between IL-10 mRNA expression and disease stage. IL-10 mRNA levels in bulk PBMCs were measured in HIV-negative subjects (n = 10; HIV-neg), HIV-infected elite controllers (n = 15; ELITE), HIV+ untreated patients (n = 20; UNTREATED), and antiretroviral drug-treated individuals, which included some subjects with suppressed viremia less than 50 copies/mL on HAART (n = 11; AVIR ARV) and others who remained viremic despite therapy (n = 12; VIR ARV). A significant difference was seen among these groups (P < .001; Kruskal Wallis test), reflecting a significant increase in IL-10 expression in HIV+ untreated and viremic-treated individuals compared with HIV-negative and elite controller subjects (P < .01 for all, Dunn posttest).
Figure 6
Figure 6
Longitudinal analysis during acute infection and the impact of therapy on IL-10 suggest an indirect link with plasma viremia. Plasma IL-10 protein concentration was measured in 3 individuals identified during acute/early HIV infection. Longitudinal samples indicated that IL-10 protein levels (solid line) were initially high, and decreased over time in 2 untreated (A-B) as well as 1 treated subject (C), corresponding with a decline in HIV viral load (dashed line). A statistically significant decline in IL-10 protein (P = .004; Wilcoxon matched pairs test) in panel D was observed in a cross-sectional analysis of 10 HIV+ individuals captured at acute/early (within the first 30 days after infection) and chronic (6-12 months after infection) time points. IL-10 protein and mRNA expression were analyzed in 2 chronically infected individuals who interrupted antiretroviral therapy. Initially, both subjects displayed undetectable plasma viral loads while on ARV, which increased substantially in the absence of treatment (E-F). Plasma IL-10 protein concentration (●) as well as IL-10 mRNA expression (□) increased slowly over time in both individuals while off of therapy, but declined after reinitiation of suppressive antiretroviral treatment. Time points on ARV therapy are indicated by shaded regions in panels B-C and E-F.
Figure 7
Figure 7
Broad expression of IL-10 mRNA in FACS-sorted cell subsets from HIV-infected subjects. CD11c+ myeloid DCs, CD123+ plasmacytoid DCs, CD14+ monocytes, CD4+ T cells, CD8+ T cells, CD19+ B cells, and CD56+ NK cells were isolated from total PBMCs using live cell FACS sorting from 9 HIV-negative and 10 HIV-infected individuals, as described in supplemental Figure 3. IL-10 mRNA expression was determined in PBMCs and each subset by quantitative RT-PCR, and values are presented as IL-10 copies relative to the HPRT housekeeping gene (A-H). Significant up-regulation of IL-10 mRNA was observed in HIV+ individuals compared with HIV-negative controls for total PBMCs (P = .028) in panel A, CD14+ monocytes (P = .035) in panel D, CD4+ T cells (P = .001) in panel E, CD8+ T cells (P = .002) in panel F, CD19+ B cells, (P < .001) in panel G, and CD56+ NK cells (P = .004) in panel H. A significant reduction in IL-10 expression was observed in CD11c+ mDCs (P = .038) (C), whereas no change was seen in CD123+ pDCs (P = .161) in panel B. All statistics were calculated using the Mann-Whitney U test.

Comment in

  • Suppressing the suppressor.
    Brooks DG. Brooks DG. Blood. 2009 Jul 9;114(2):233. doi: 10.1182/blood-2009-04-218073. Blood. 2009. PMID: 19589930 No abstract available.

Similar articles

Cited by

References

    1. Munier ML, Kelleher AD. Acutely dysregulated, chronically disabled by the enemy within: T-cell responses to HIV-1 infection. Immunol Cell Biol. 2007;85:6–15. - PubMed
    1. Shin H, Wherry EJ. CD8 T cell dysfunction during chronic viral infection. Curr Opin Immunol. 2007;19:408–415. - PubMed
    1. Chougnet C, Gessani S. Role of gp120 in dendritic cell dysfunction in HIV infection. J Leukoc Biol. 2006;80:994–1000. - PubMed
    1. Piguet V, Steinman RM. The interaction of HIV with dendritic cells: outcomes and pathways. Trends Immunol. 2007;28:503–510. - PMC - PubMed
    1. Barber DL, Wherry EJ, Masopust D, et al. Restoring function in exhausted CD8 T cells during chronic viral infection. Nature. 2006;439:682–687. - PubMed

Publication types

MeSH terms