. 2009 Aug;57(8):741-51.
doi: 10.1369/jhc.2009.953646. Epub 2009 Apr 13.

Fluorescence and electron microscopic localization of F-actin in the ependymocytes

Affiliations

Fluorescence and electron microscopic localization of F-actin in the ependymocytes

Yan-Chao Li et al. J Histochem Cytochem. 2009 Aug.

Abstract

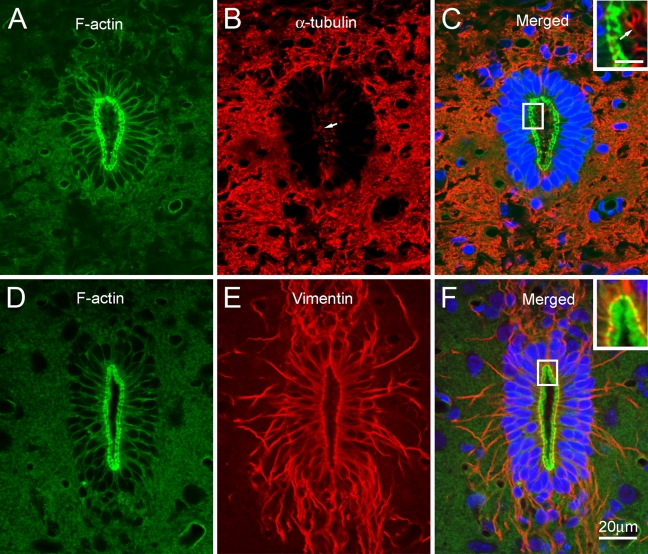
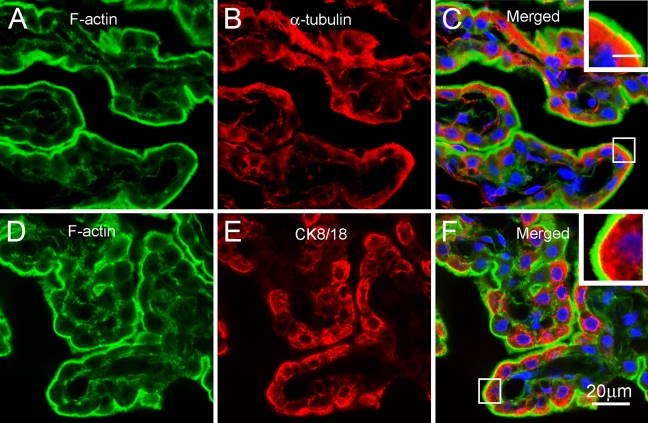
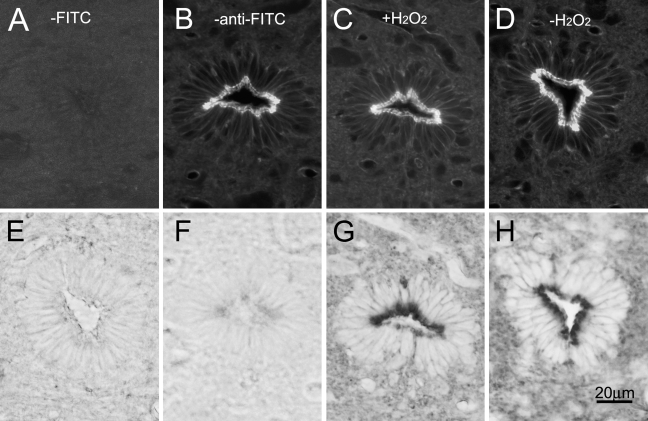
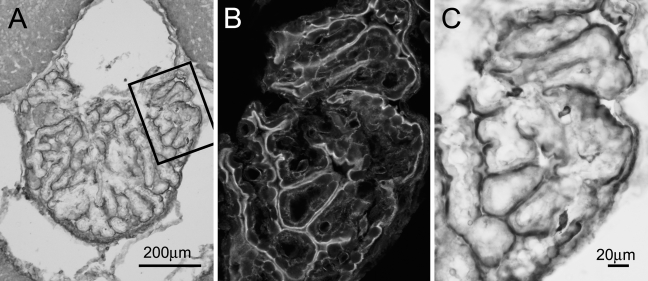
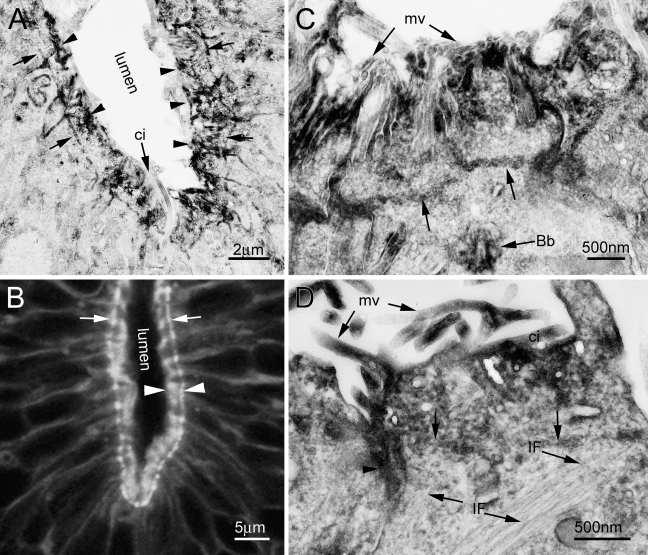
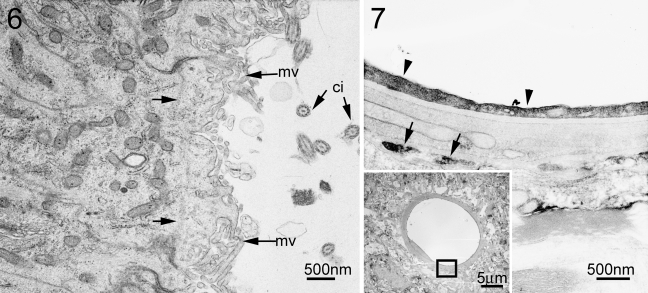
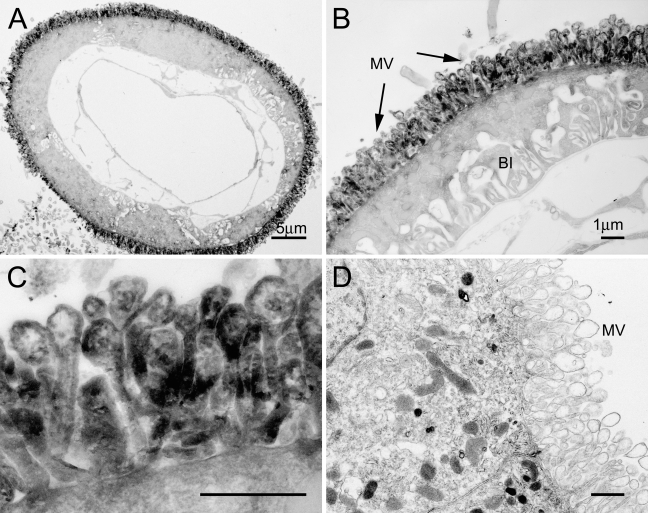
The organization of F-actin in the ventricular system has been reported to display pronounced regional differences with respect to shape, size, and development. However, the real roles played by F-actin in these cells cannot be understood unless the precise localization of F-actin is defined. In the present study, we used double-fluorescence labeling to further examine the localization of F-actin in the ependymocytes and its spatial relation to the other two cytoskeletal components, microtubules and intermediate filaments. Then we converted fluorescence signals for F-actin to peroxidase/DAB reaction products by use of a phalloidin-based FITC-anti-FITC system. This detection technique provided an overview of the distribution of F-actin in the ependymocytes at the ultrastructural level, and has been proven to be helpful in correlating light and electron microscopic investigations.


Figures

Figure 1
Figure 1
Fluorescence microscopic localization of F-actin, α-tubulin, and vimentin in the central canal. The ependymocytes of the central canal contain peripherally distributed F-actin (A,D). In the apical region, F-actin is arranged into a ring-like structure surrounding the lumen of the central canal. The lateral cell margins are also less intensely labeled. Positive signals for α-tubulin are seen predominantly in the apical region of the central canal, where they are present in the cytoplasmic protrusions of the ependymocytes (arrow in B). C is merged from A and B. No F-actin labeling is found in the α-tubulin–positive structures protruding into the lumen (arrow in C). Nuclei were stained blue with 4′-6-diamidino-2-phenylindole (DAPI). Vimentin-positive components are organized into a polarized network in the central canal (E). In the apical region, vimentin filaments run circumferentially beneath the apical F-actin network. Basally, they extend along the peripheral processes of ependymocytes into the subependymal zone with a root-like appearance. F is merged from D and E. The inset shows the colocalization (yellow color) of vimentin with F-actin in the outer boundary of the F-actin ring. Nuclei were stained blue with DAPI. Bar in inset = 5 μm.
Figure 2
Figure 2
Fluorescence microscopic localization of F-actin, α-tubulin, and vimentin in the choroid plexus. In the choroid plexus, F-actin is localized predominantly in the apical region, appearing as a bright uninterrupted belt along the luminal surface (A,D). Less-intense labeling is also noted in the stroma of the choroid plexus. The perinuclear cytoplasm of ependymocytes was positive for anti–α-tubulin (B) and anti–cytokeratin antibody (E). C is merged from A and B, showing that almost no protrusions positive for α-tubulin are present on the luminal surface. The inset shows a partial colocalization (yellow color) of α-tubulin with F-actin in the periphery of the F-actin network. Nuclei were stained blue with DAPI. F is merged from D and E. The inset shows a partial colocalization (yellow color) of cytokeratin with F-actin in the periphery of the F-actin network. Nuclei were stained blue with DAPI. Bar in inset = 5 μm.
Figure 3
Figure 3
Comparison of F-actin staining in the central canal between fluorescence and light microscopic images. The panels in the upper and lower row show fluorescence and light microscopic images, respectively. It is worth mentioning that confocal laser scanning microscopy can visualize F-actin clearly with no interference due to out-of-focus noise. (A,E) No fluorescence signals are detected when FITC-conjugated phalloidin is replaced with 0.1 M phosphate buffer (PB) rinse buffer (A). The same section is subsequently incubated with biotinylated anti-FITC antibody, followed by detection with the avidin–biotin–peroxidase complex (ABC) method. However, this does not reveal any positive labeling in the central canal (E). (B,F) FITC-conjugated phalloidin staining reveals a ring-like network in the central canal (B). F-actin is directly detected in the same section using the ABC method. No peroxidase/DAB reaction products are observed in the central canal (F). (C,G) Fluorescence signals for F-actin are detectable after pretreatment with 3% H2O2 in 0.1 M PB (C). The same section is then reacted with biotinylated anti-FITC antibody, followed by detection using the ABC method. Peroxidase/DAB reaction products are found predominantly in the apical region of the central canal (G). (D,H) FITC-conjugated phalloidin staining reveals a ring-like network in the central canal in the section without pretreatment with H2O2 (D). The same section is then reacted with biotinylated anti-FITC antibody, followed by detection using the ABC method. Peroxidase/DAB reaction products are localized predominantly in the apical region of the central canal (H). It is noted that no discernable differences in the distribution of F-actin are found in the sections pretreated with and without H2O2.
Figure 4
Figure 4
Comparison of F-actin staining in the choroid plexus between fluorescence and light microscopic images. (A) Distribution of peroxidase/DAB reaction products for F-actin in the diencephalic choroid plexus, revealed by use of the phalloidin-based FITC-anti-FITC technique. The area within the rectangle in A is enlarged in B and C to show fluorescence and DAB labeling, respectively. Bar in C applies to B.
Figure 5
Figure 5
Ultrastructural localization of F-actin in the central canal. The electron microscopic (EM) image in A gives an overview of the distribution of F-actin in the central canal at low magnification. The peroxidase/DAB reaction products for F-actin are localized predominantly in the apical aspects in the central canal, with only a diffuse staining in the remaining cytoplasm. In the apical region, microvilli (arrowheads in A; see C and D for more detail) are found as the major component positive for F-actin. Beneath the microvilli, a circumferential F-actin network (arrows) runs parallel to the apical surface of the ependymocytes by associating with the plasmalemma thickenings between adjacent cells. Notably, the labeling for F-actin is not even in the cytoplasm between microvilli and the circumferential F-actin network. A cilium (arrow indicated by ci) is also seen protruding into the lumen of the central canal, but its shaft shows little labeling for F-actin. (B) Fluorescence image of F-actin in the central canal. Arrows indicate the outer boundary of the F-actin ring. The distance between the two arrowheads has previously been defined as the width of the apical F-actin network. By comparing the fluorescence and EM images, the circumferential F-actin network (i.e., the terminal web, arrows in A) is found as the structural equivalent to the outer boundary of the F-actin fluorescence ring (arrows in B), whereas the distance between the terminal web and the tip of the microvilli corresponds to the width of the fluorescence ring. (C,D) Apical region of ependymocytes at higher magnification. The apical surface of the ependymocytes is covered with a profusion of microvilli (arrows labeled by mv). Microvillous cores are labeled from the tip downward to the apical cytoplasm, where they are seen frequently connected to an intensely labeled circumferential F-actin network (arrows). The cytoplasmic sides of intermediate junctions show a darkened thickening (arrowhead). A basal body (Bb), which shows a darkened appearance, is seen in C. Intermediate filaments (arrows labeled by IF) are unlabeled, but they frequently loop up and connect to the circumferential F-actin bundles (D).
Figure 6
Figure 6
EM image from negative control. No labeling is found in the apical region of the central canal of the negative control. The apical surface of the ependymocytes is characterized by a profusion of microvilli (mv) and a varying number of cilia (ci, transverse-cut in this section). Terminal web (arrows) is discernable spanning between the neighboring junctions.
Figure 7
Figure 7
EM image showing a portion of a capillary (inset). Intense labeling for F-actin is seen continuously in the luminal border of the endothelial cell (arrowheads). Sporadic labeling is also observed in the perivascular glial endfeet (arrows).
Figure 8
Figure 8
EM images showing the localization of F-actin in the choroid plexus. The apical regions of the choroid ependymocytes are intensely stained with the peroxidase/DAB reaction products, whereas the staining is relatively rare in the remaining cytoplasm (A,B). BI, basal infoldings. Labeling is observed along the whole length of the microvilli, but is often absent in the center of their bulbous ends (B,C). Cilia or junctional membrane thickenings are not observed. Although there is patchy staining beneath the microvilli at their base, no apparent terminal web is seen beneath the microvilli (C). (D) Apical region of a choroidal ependymocyte from negative control. The luminal border of the ependymocyte is covered with numerous pleomorphic microvilli, most of which have an electron-lucent center in their bulbous ends. No apparent circumferentially running F-actin bundles are seen beneath the microvilli. Bars: B–D = 1 μm.

Similar articles

Cited by

References

    1. Bray D, White JG (1988) Cortical flow in animal cells. Science 239:883–888 - PubMed
    1. Brightman MW, Palay SL (1963) The fine structure of ependyma in the brain of the rat. J Cell Biol 19:415–439 - PMC - PubMed
    1. Bruni JE, Reddy K (1987) Ependyma of the central canal of the rat spinal cord: a light and transmission electron microscopic study. J Anat 152:55–70 - PMC - PubMed
    1. Capani F, Deerinck TJ, Ellisman MH, Bushong E, Bobik M, Martone ME (2001) Phalloidin-eosin followed by photo-oxidation: a novel method for localizing F-actin at the light and electron microscopic levels. J Histochem Cytochem 49:1351–1361 - PubMed
    1. Castellani-Ceresa L, Brivio MF, Radaelli G (1991) Electron microscopic localization of F-actin in acrosome reacted boar spermatozoa by means of a phalloidin-FITC complex. J Submicrosc Cytol Pathol 23:347–349 - PubMed

MeSH terms