

doi: 10.1002/0471140864.ps1905s56.
Imaging protein-protein interactions by Förster resonance energy transfer (FRET) microscopy in live cells
Affiliations
- PMID: 19365789
- PMCID: PMC3568943
- DOI: 10.1002/0471140864.ps1905s56
Item in Clipboard
Imaging protein-protein interactions by Förster resonance energy transfer (FRET) microscopy in live cells
Curr Protoc Protein Sci.
2009 Apr.
Abstract
This unit describes an acceptor-sensitized emission FRET method using a confocal microscope for image acquisition. In contrast to acceptor photobleaching, which is an end-point assay that destroys the acceptor fluorophore, the sensitized emission method is amenable for FRET measurements in live cells and can be used to measure changes in FRET efficiency over time. The purpose of this unit is to provide a basic starting point for understanding and performing the sensitized emission method with a simple teaching tool for live-cell imaging. References that discuss the vagaries of acquiring and analyzing FRET between individually tagged molecules are provided.
Figures
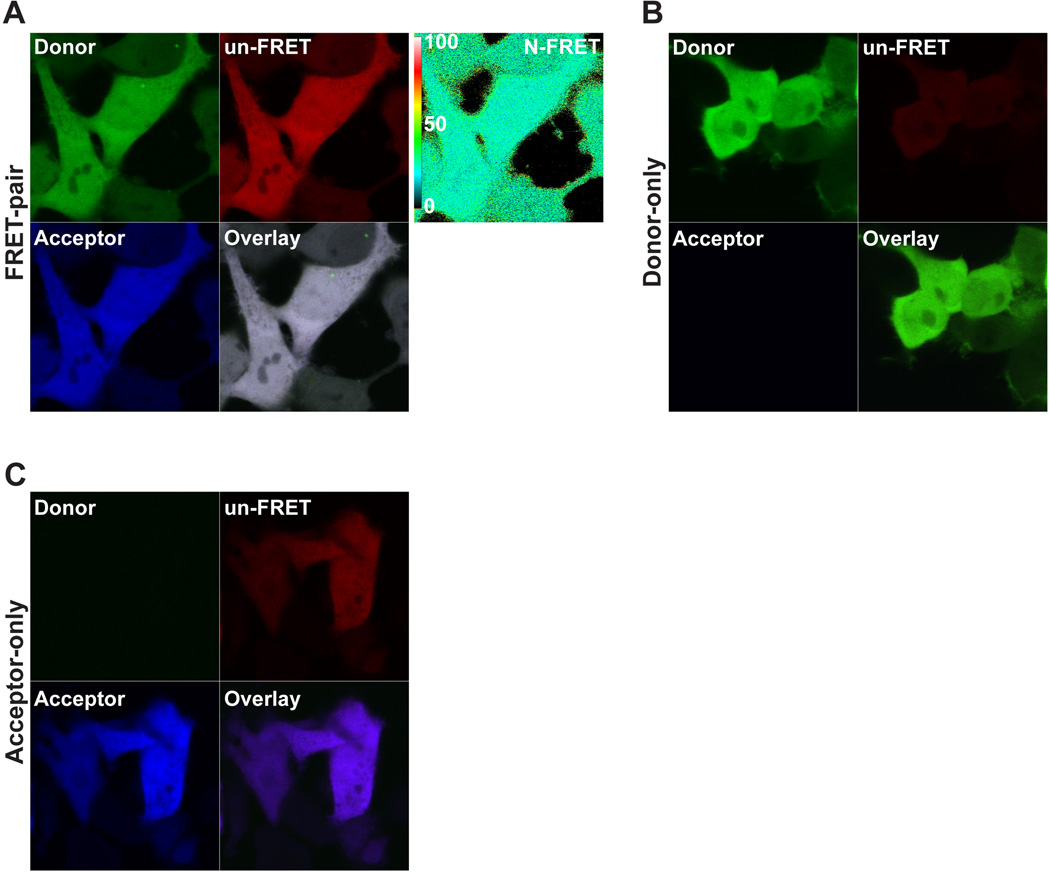
An example acquisition of the acceptor sensitized emission method using cells expressing the FRET-pair C32V (A), the Donor-only C32A (B), and the Acceptor only V1 (C) is shown. See Fig. 3 for statistical results. The Donor panel (Track 1, Ch2) is the Cerulean intensity from resulting 458 nm laser excitation collected through a 470 – 500 nm bandpass filter. The un-FRET panel (Track 1, Ch3) is the uncorrected FRET intensity resulting from 458 nm laser excitation collected through a 530 nm longpass filter. The Acceptor panel (Track 2, Ch3) is the Venus intensity resulting from 514 nm laser excitation collected through a 530 nm longpass filter. Each set was imaged using the conditions described in the protocol above. The 458 and 514 nm laser power was 4% and 0.3% respectively. The N-FRET image calculated in the LSM software package is shown with the scale bar in (A). Note the spectral bleedthrough in the control images: In (B), Donor-only spectral bleedthrough is observed in the uncorrected FRET channel after excitation with the Donor laser (458 nm), while no crosstalk is detected in the Acceptor channel by direct excitation with the Acceptor laser (514 nm). In (C), Acceptor-only crosstalk is detected in the uncorrected FRET channel after excitation with the Donor laser. For these experiments the resulting Donor-only signal in the Donor channel after excitation with the Acceptor laser is negligible, but keep in mind that it may be necessary to subtract this crosstalk for other FRET pairs.
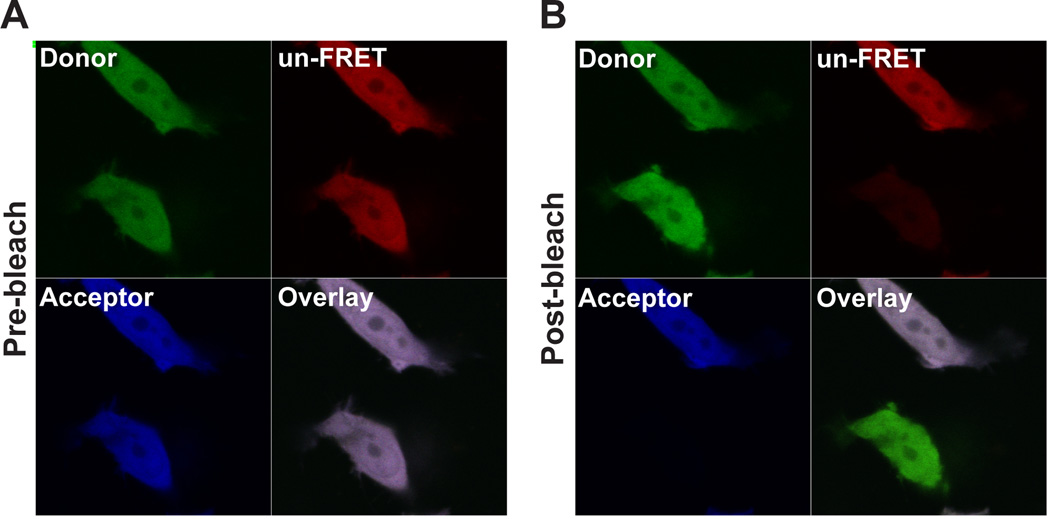
An example of the acceptor photobleaching method using cells expressing the FRET pair C17V. (A) The pre-bleach image is shown. (B) The post-bleach image shows the bottom cell bleached after 200 iterations and the expected increase in Donor fluorescence after photobleaching.
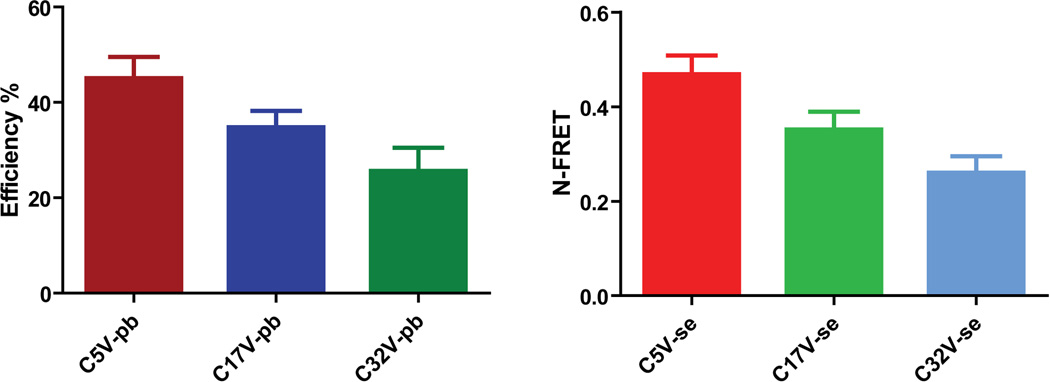
Shown is the average FRET efficiency (%) by Acceptor photobleaching (pb) and N-FRET values calculated in the LSM software for the sensitized emission method (se). Specific values and SD for photobleaching are: C5V-pb: 45.1% +/− 4.42%, n=13; C17V-pb: 34.8% +/− 3.47%, n=11; C32V-pb: 25.6% +/− 4.89%, n=17. Specific values and SD for N-FRET are: C5V-se: 0.469 +/− 0.0396, n=39; C17V-se: 0.352 +/− 0.0372, n=43; C32V-se: 0.260 +/− 0.0351, n=51.
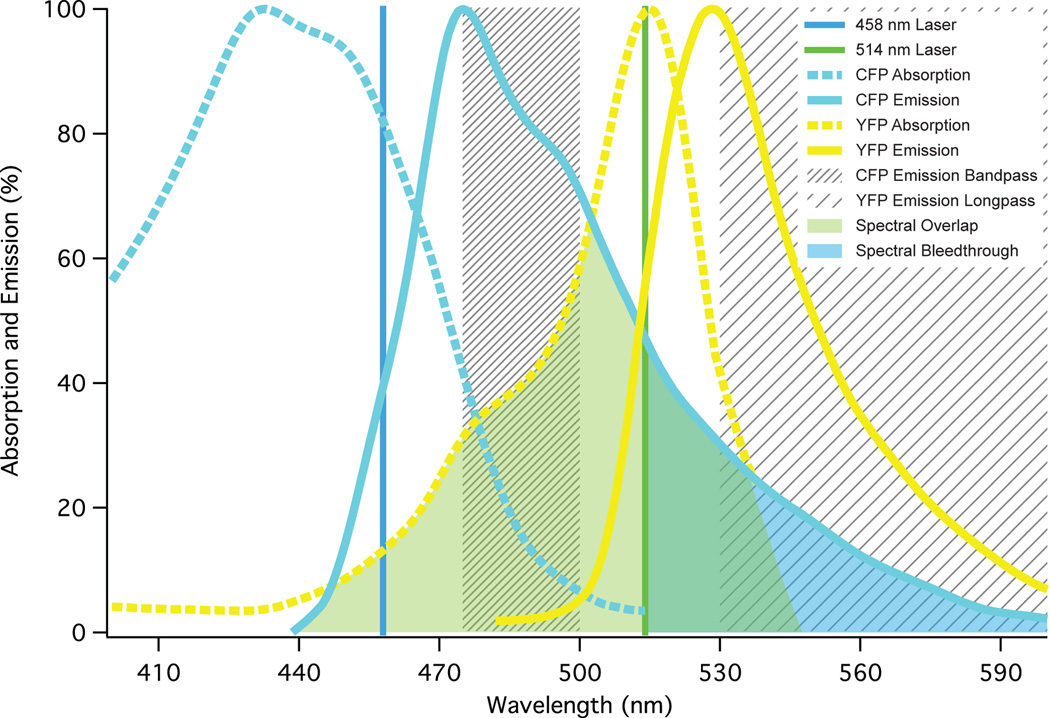
Shown are the excitation (dashed) and emission (solid) spectra of the Donor CFP (blue) and Acceptor YFP (yellow); also shown are Donor and Acceptor excitation laser lines (458 and 514 nm; note the direct excitation of YFP by 458 nm), and Donor and Acceptor bandpass and longpass emission filter ranges respectively (hatched boxes in nm). The spectral overlap integral of the Donor emission and Acceptor excitation is shown in light green and the Donor spectral bleedthrough into the Acceptor channel is shown in light yellow.
References
-
- Becker W. Advanced Time-Correlated Single Photon Counting Techniques. Berlin: Springer; 2005.
-
- Förster T. Experimental and theoretical investigation of the intermolecular transfer of electronic excitation energy. Z. Naturforsch. A. 1949;4:7.
-
- Giepmans BN, Adams SR, et al. The fluorescent toolbox for assessing protein location and function. Science. 2006;312(5771):217–224. - PubMed
-
- Janetopoulos C, Jin T, et al. Receptor-mediated activation of heterotrimeric G-proteins in living cells. Science. 2001;291(5512):2408–2411. - PubMed
Publication types
MeSH terms
Substances
Grants and funding
LinkOut - more resources
Full Text Sources
