

Compartment-specific regulation of plasma membrane calcium ATPase type 2 in the chick auditory brainstem
- PMID: 19365819
- PMCID: PMC2702515
- DOI: 10.1002/cne.22045
Compartment-specific regulation of plasma membrane calcium ATPase type 2 in the chick auditory brainstem
Abstract
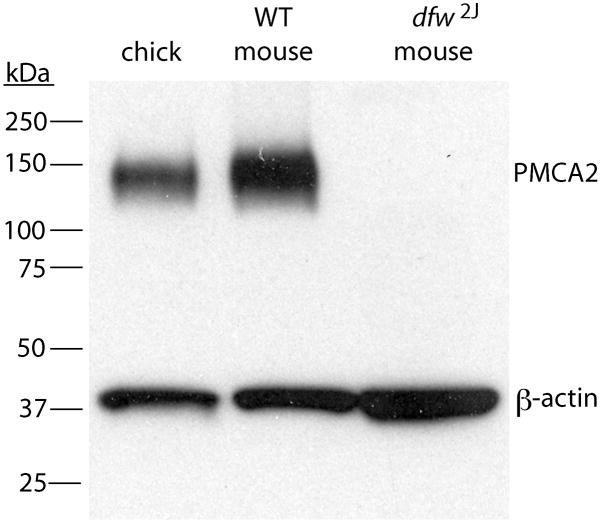
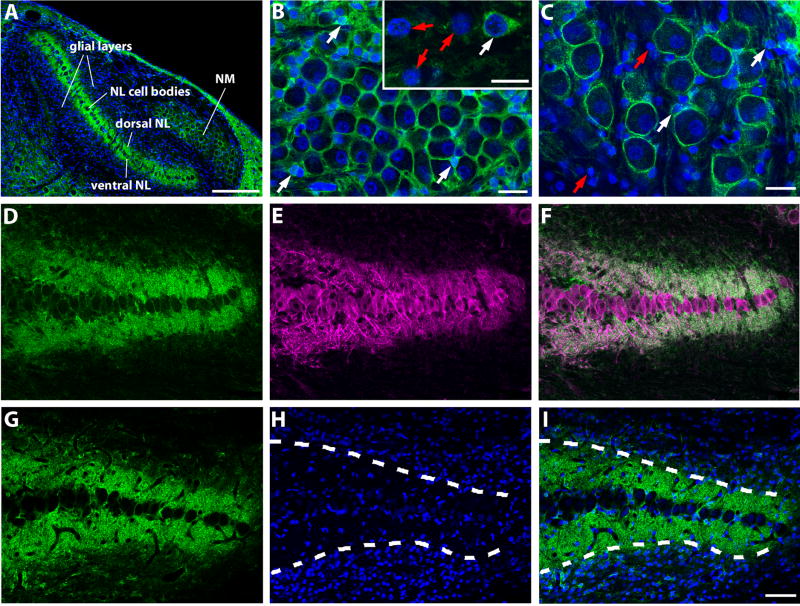
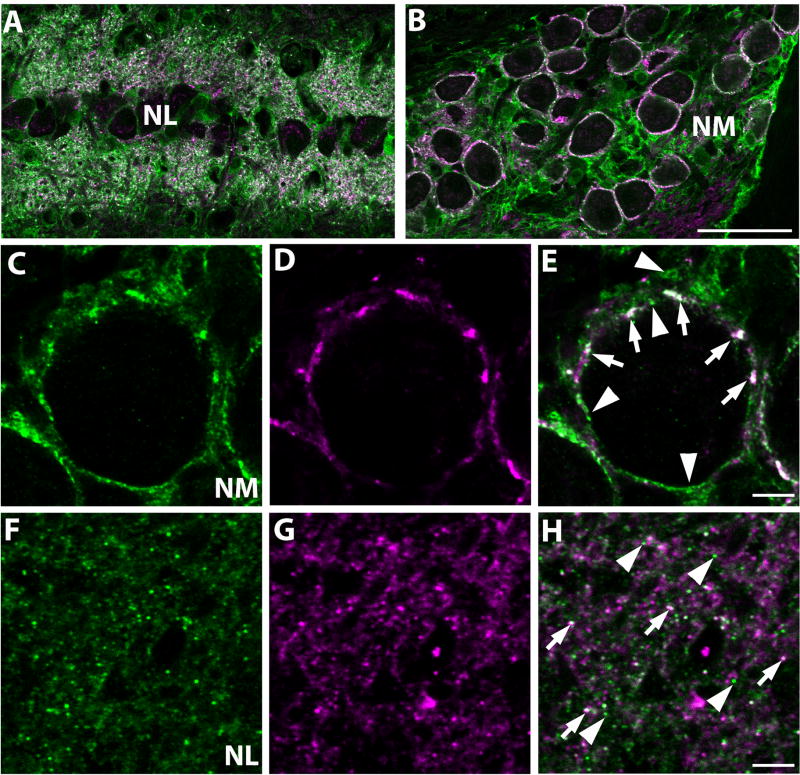
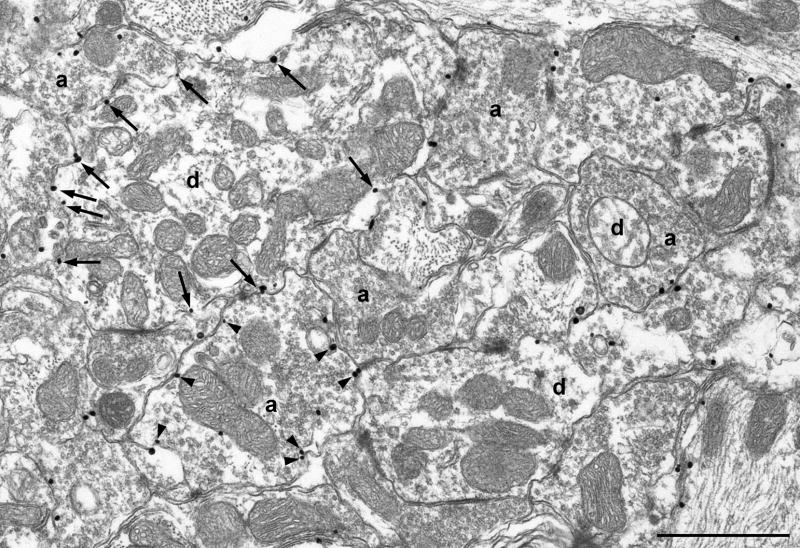
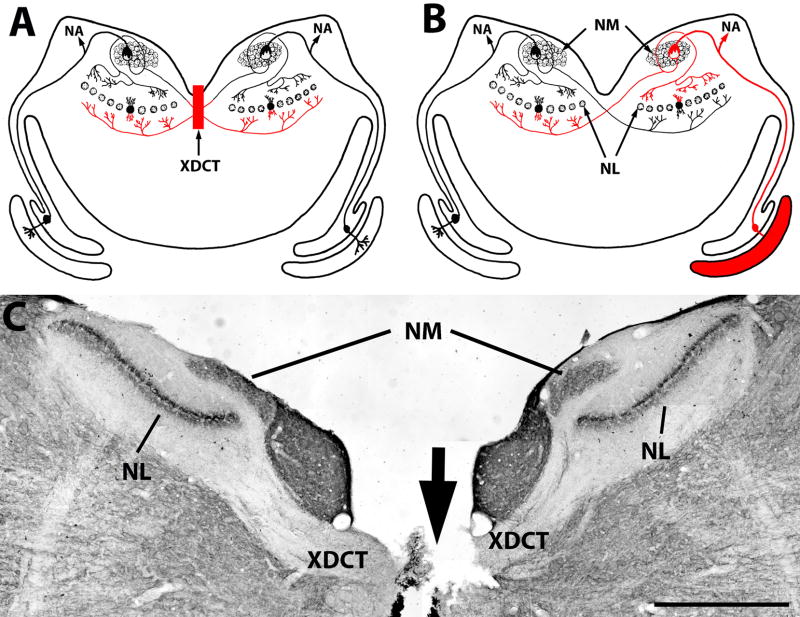
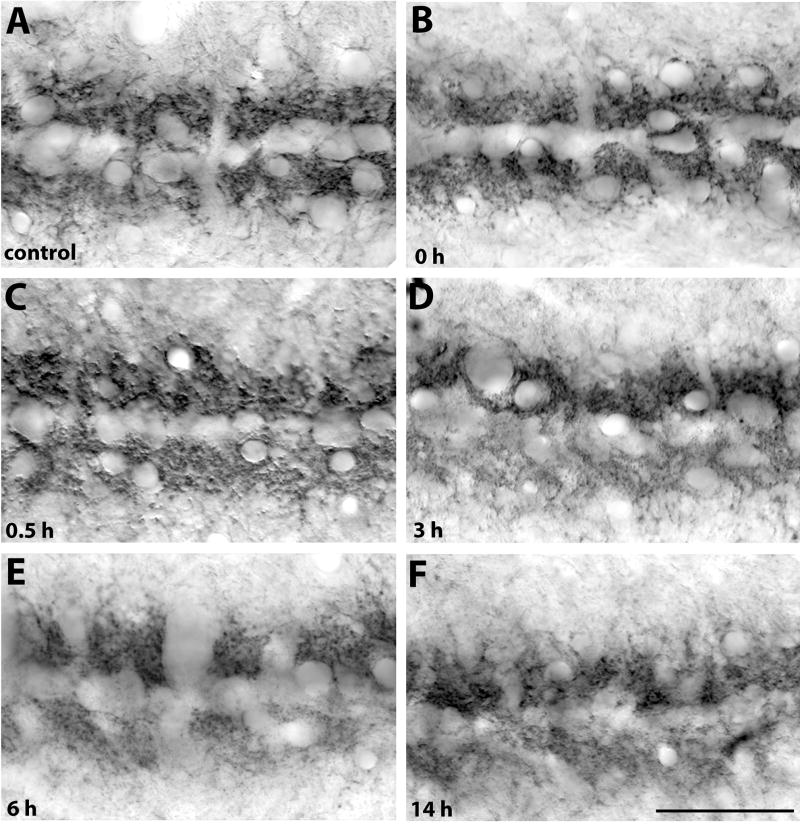
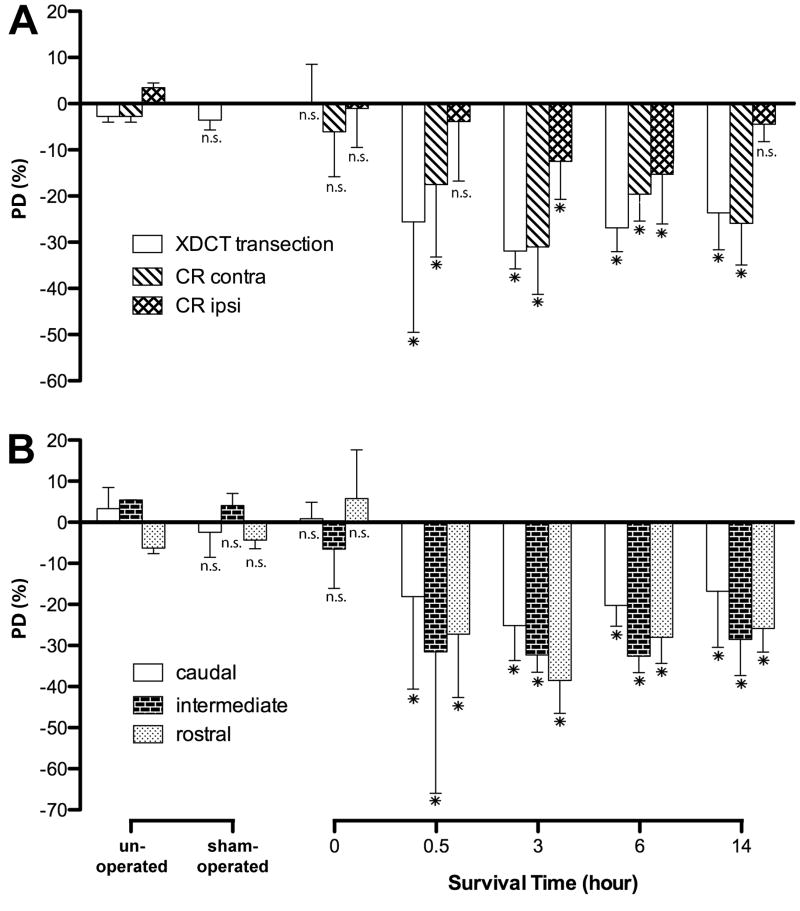
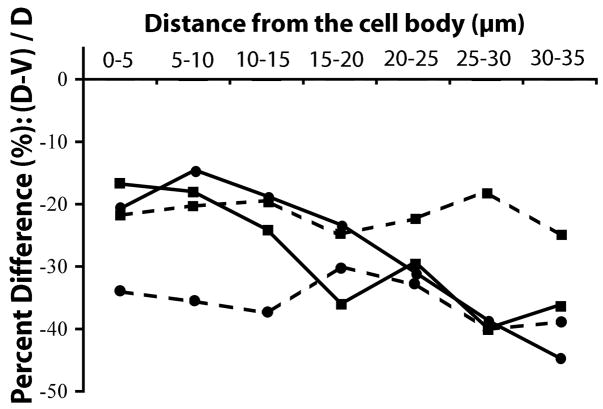
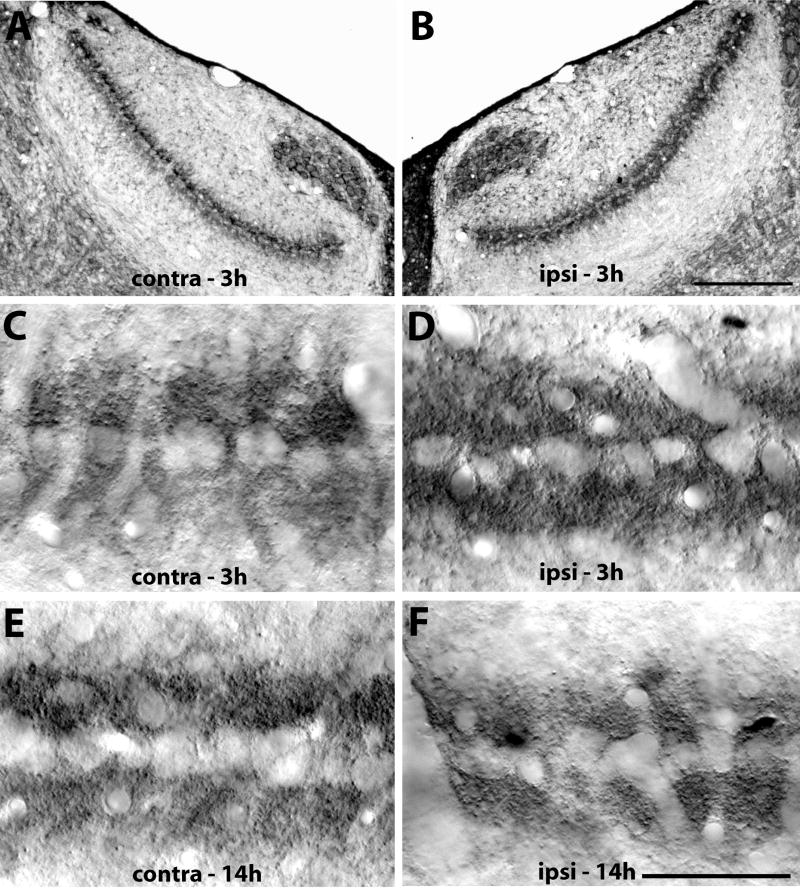
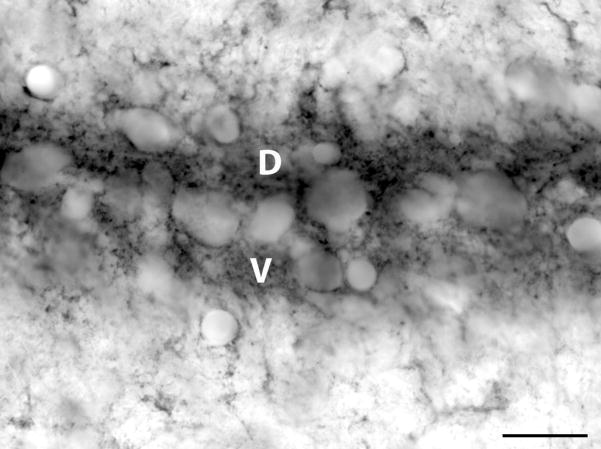
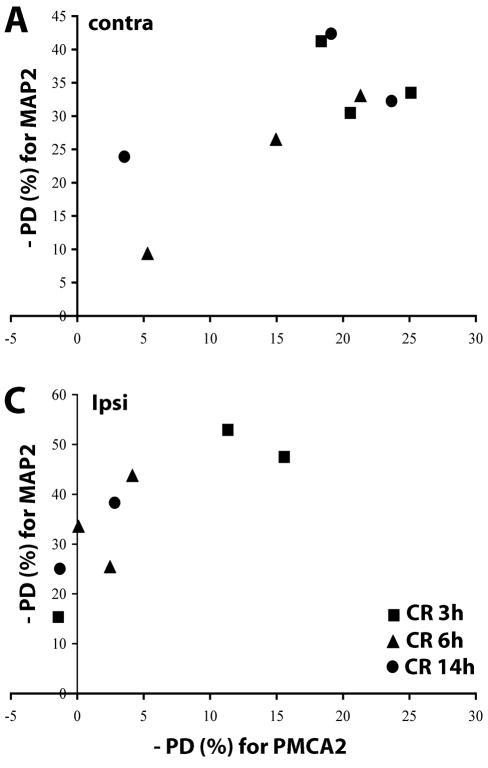
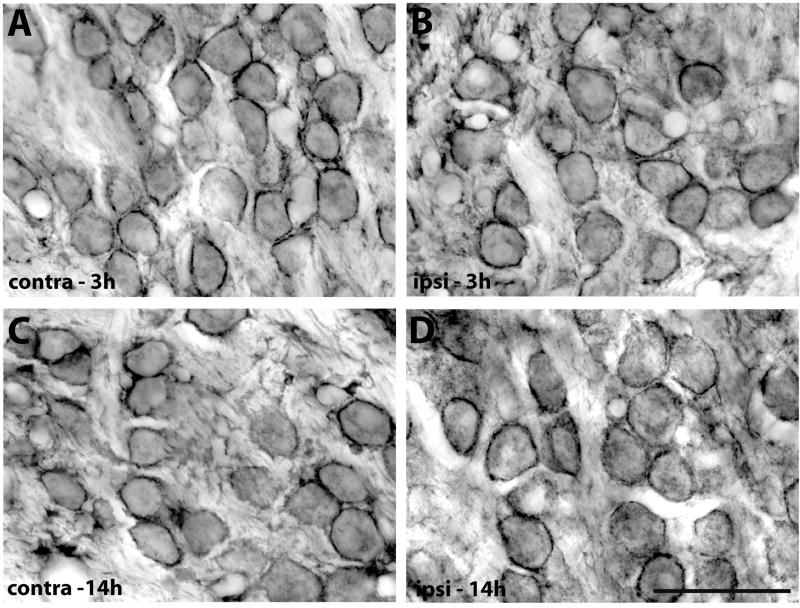
Calcium signaling plays a role in synaptic regulation of dendritic structure, usually on the time scale of hours or days. Here we use immunocytochemistry to examine changes in expression of plasma membrane calcium ATPase type 2 (PMCA2), a high-affinity calcium efflux protein, in the chick nucleus laminaris (NL) following manipulations of synaptic inputs. Dendrites of NL neurons segregate into dorsal and ventral domains, receiving excitatory input from the ipsilateral and contralateral ears, respectively, via nucleus magnocellularis (NM). Deprivation of the contralateral projection from NM to NL leads to rapid retraction of ventral, but not the dorsal, dendrites of NL neurons. Immunocytochemistry revealed symmetric distribution of PMCA2 in two neuropil regions of normally innervated NL. Electron microscopy confirmed that PMCA2 localizes in both NM terminals and NL dendrites. As early as 30 minutes after transection of the contralateral projection from NM to NL or unilateral cochlea removal, significant decreases in PMCA2 immunoreactivity were seen in the deprived neuropil of NL compared with the other neuropil that continued to receive normal input. The rapid decrease correlated with reductions in the immunoreactivity for microtubule-associated protein 2, which affects cytoskeleton stabilization. These results suggest that PMCA2 is regulated independently in ventral and dorsal NL dendrites and/or their inputs from NM in a way that is correlated with presynaptic activity. This provides a potential mechanism by which deprivation can change calcium transport that, in turn, may be important for rapid, compartment-specific dendritic remodeling.
Figures
Similar articles
-
In vivo reversible regulation of dendritic patterning by afferent input in bipolar auditory neurons.J Neurosci. 2012 Aug 15;32(33):11495-504. doi: 10.1523/JNEUROSCI.1737-12.2012. J Neurosci. 2012. PMID: 22895732 Free PMC article.
-
Rapid regulation of microtubule-associated protein 2 in dendrites of nucleus laminaris of the chick following deprivation of afferent activity.Neuroscience. 2008 Jun 12;154(1):381-9. doi: 10.1016/j.neuroscience.2008.02.032. Epub 2008 Feb 29. Neuroscience. 2008. PMID: 18440716 Free PMC article.
-
Activity-dependent synaptic integration and modulation of bilateral excitatory inputs in an auditory coincidence detection circuit.J Physiol. 2018 May 15;596(10):1981-1997. doi: 10.1113/JP275735. Epub 2018 Apr 16. J Physiol. 2018. PMID: 29572827 Free PMC article.
-
Cytochrome oxidase response to cochlea removal in chicken auditory brainstem neurons.J Comp Neurol. 1990 Jul 15;297(3):329-39. doi: 10.1002/cne.902970302. J Comp Neurol. 1990. PMID: 2168902
-
The analysis of interaural time differences in the chick brain stem.Physiol Behav. 2005 Oct 15;86(3):297-305. doi: 10.1016/j.physbeh.2005.08.003. Epub 2005 Oct 3. Physiol Behav. 2005. PMID: 16202434 Free PMC article. Review.
Cited by
-
Transgenic quail as a model for research in the avian nervous system: a comparative study of the auditory brainstem.J Comp Neurol. 2013 Jan 1;521(1):5-23. doi: 10.1002/cne.23187. J Comp Neurol. 2013. PMID: 22806400 Free PMC article.
-
Proteomic analyses of nucleus laminaris identified candidate targets of the fragile X mental retardation protein.J Comp Neurol. 2017 Oct 15;525(15):3341-3359. doi: 10.1002/cne.24281. Epub 2017 Jul 24. J Comp Neurol. 2017. PMID: 28685837 Free PMC article.
-
Intense and specialized dendritic localization of the fragile X mental retardation protein in binaural brainstem neurons: a comparative study in the alligator, chicken, gerbil, and human.J Comp Neurol. 2014 Jun 15;522(9):2107-28. doi: 10.1002/cne.23520. J Comp Neurol. 2014. PMID: 24318628 Free PMC article.
-
Dynamics of the fragile X mental retardation protein correlates with cellular and synaptic properties in primary auditory neurons following afferent deprivation.J Comp Neurol. 2021 Feb;529(3):481-500. doi: 10.1002/cne.24959. Epub 2020 Jun 27. J Comp Neurol. 2021. PMID: 32449186 Free PMC article.
-
Maintenance of neuronal size gradient in MNTB requires sound-evoked activity.J Neurophysiol. 2017 Feb 1;117(2):756-766. doi: 10.1152/jn.00528.2016. Epub 2016 Nov 23. J Neurophysiol. 2017. PMID: 27881722 Free PMC article.
References
-
- Benes FM, Parks TN, Rubel EW. Rapid dendritic atrophy following deafferentation: an EM morphometric analysis. Brain Res. 1977;122:1–13. - PubMed
-
- Bennett J, Weeds A. Calcium and the cytoskeleton. Br Med Bull. 1986;42:385–390. - PubMed
-
- Berod A, Hartman BK, Pujol JF. Importance of fixation in immunohistochemistry: use of formaldehyde solutions at variable pH for the localization of tyrosine hydroxylase. J Histochem Cytochem. 1981;29:844–850. - PubMed
-
- Blaustein MP, Juhaszova M, Golovina VA, Church PJ, Stanley EF. Na/Ca exchanger and PMCA localization in neurons and astrocytes: functional implications. Ann N Y Acad Sci. 2002;976:356–366. - PubMed
Publication types
MeSH terms
Substances
Grants and funding
LinkOut - more resources
Full Text Sources
Research Materials
Miscellaneous
