. 2009 Jul;62(1):17-25.
doi: 10.1002/mrm.21970.

Short echo spectroscopic imaging of the human brain at 7T using transceiver arrays

Affiliations

Short echo spectroscopic imaging of the human brain at 7T using transceiver arrays

N I Avdievich et al. Magn Reson Med. 2009 Jul.

Abstract

Recent advances in magnet technology have enabled the construction of ultrahigh-field magnets (7T and higher) that can accommodate the human head and body. Despite the intrinsic advantages of performing spectroscopic imaging at 7T, increased signal-to-noise ratio (SNR), and spectral resolution, few studies have been reported to date. This limitation is largely due to increased power deposition and B(1) inhomogeneity. To overcome these limitations, we used an 8-channel transceiver array with a short TE (15 ms) spectroscopic imaging sequence. Utilizing phase and amplitude mapping and optimization schemes, the 8-element transceiver array provided both improved efficiency (17% less power for equivalent peak B(1)) and homogeneity (SD(B(1)) = +/-10% versus +/-22%) in comparison to a transverse electromagnetic (TEM) volume coil. To minimize the echo time to measure J-modulating compounds such as glutamate, we developed a short TE sequence utilizing a single-slice selective excitation pulse followed by a broadband semiselective refocusing pulse. Extracerebral lipid resonances were suppressed with an inversion recovery pulse and delay. The short TE sequence enabled visualization of a variety of resonances, including glutamate, in both a control subject and a patient with a Grade II oligodendroglioma.


Figures

Fig. 1
Fig. 1
Schematic of two elements of the 8 element transceiver coil.
Fig. 2
Fig. 2
The short echo sequence includes the following pulses: a single slice selective excitation (red), a broad band refocusing pulse (green), a low amplitude (∼100 Hz) frequency selective (±150 Hz) adiabatic inversion pulse (green) and an adiabatic inversion pulse (yellow) with a recovery delay of 350ms to suppress lipids. Gradient dephasing is used (light purple). Phase encoding is applied in 2 dimensions (orange).
Fig. 3
Fig. 3
Displayed in 3A are B1 maps (amplitude and phase) relative to coil #1 from each of the 8 coils. The image in 3B displays the two ROIs used for optimizing the transmit phase (60mm diameter) and transmit amplitude (150mm×120mm). Displayed in 3C is the B1 map obtained using simultaneous transmission from all 8 coils after optimization of the phase and amplitude.
Fig. 4
Fig. 4
Displayed are a coronal (4a) and axial (4b) image of B1 acquired from a TEM using a peak power of 3.5kW. Displayed in 4c and 4d are the corresponding B1 images acquired using an 8 element transceiver array and a peak power of 2.9kW.
Fig. 5
Fig. 5
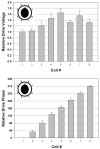
Displayed in 5a and 5b are the mean and standard deviation of the relative drive voltage (5a) and phase (5b) for each coil in n=5 subjects. The mean drive voltage and phase has been referenced to the mean value of coil #1. Displayed in the inset is a cartoon indicating the orientation of the B1 of each coil to the head.
Fig. 6
Fig. 6
Displayed are plots of η for the two optimization schemes: a) where the phase is calculated and the amplitude is allowed to vary and b) where both the amplitude and phase are allowed to vary.
Fig. 7
Fig. 7
Displayed is the scout image showing the SI grid (24×24 over a FOV of 192×192, 10mm thickness) and spectra from 7 locations. Displayed below the scout image is a representative spectrum (location G) showing the resonances of creatine (Cr), myoinositol (mI), choline (Ch), glutamine (Gln), glutamate (Glu) and N-acetylaspartate (NAA). The full spectra from the 7 locations are shown to the right, including the residual water resonance. No post processing of the water resonance was necessary. The inverted down field resonance at 7.8ppm is NAA.
Fig. 8
Fig. 8
Displayed on the left are the scout images acquired at 7T and FLAIR and post Gd injection images acquired at 3T. Displayed in the central column are 7T scout images displaying the spectral locations selected for display from the tumor (top) and a control region (bottom). The boundaries of the ROIs selected for display are shown in green on the scout images. Displayed to the far right are spectra corresponding to the ROIs selected for display. The position of the lactate resonance is denoted by Lac.

Similar articles

Cited by

References

    1. Robitaille PM, Abduljalil AM, Kangarlu A, Zhang X, Yu Y, Burgess R, Bair S, Noa P, Yang L, Zhu H, Palmer B, Jiang Z, Chakeres DM, Spigos D. Human magnetic resonance imaging at 8 T. NMR Biomed. 1998;11(6):263–265. - PubMed
    1. Vaughan JT, Garwood M, Collins CM, Liu W, DelaBarre L, Adriany G, Andersen P, Merkle H, Goebel R, Smith MB, Ugurbil K. 7T vs. 4T: RF power, homogeneity, and signal-to-noise comparison in head images. Magn Reson Med. 2001;46(1):24–30. - PubMed
    1. Adriany G, Van de Moortele PF, Wiesinger F, Moeller S, Strupp JP, Andersen P, Snyder C, Zhang X, Chen W, Pruessmann KP, Boesiger P, Vaughan T, Ugurbil K. Transmit and receive transmission line arrays for 7 Tesla parallel imaging. Magn Reson Med. 2005;53(2):434–445. - PubMed
    1. Adriany G, Van de Moortele PF, Ritter J, Moeller S, Auerbach EJ, Akgun C, Snyder CJ, Vaughan T, Ugurbil K. A geometrically adjustable 16-channel transmit/receive transmission line array for improved RF efficiency and parallel imaging performance at 7 Tesla. Magn Reson Med. 2008;59(3):590–597. - PubMed
    1. Scheenen TW, Heerschap A, Klomp DW. Towards 1H-MRSI of the human brain at 7T with slice-selective adiabatic refocusing pulses. MAGMA. 2008;21(1-2):95–101. - PMC - PubMed

Publication types

MeSH terms