. 2009 May;1788(5):1033-43.
doi: 10.1016/j.bbamem.2009.01.006. Epub 2009 Jan 27.

Mechanisms of polyelectrolyte enhanced surfactant adsorption at the air-water interface

Affiliations

Mechanisms of polyelectrolyte enhanced surfactant adsorption at the air-water interface

Patrick C Stenger et al. Biochim Biophys Acta. 2009 May.

Abstract

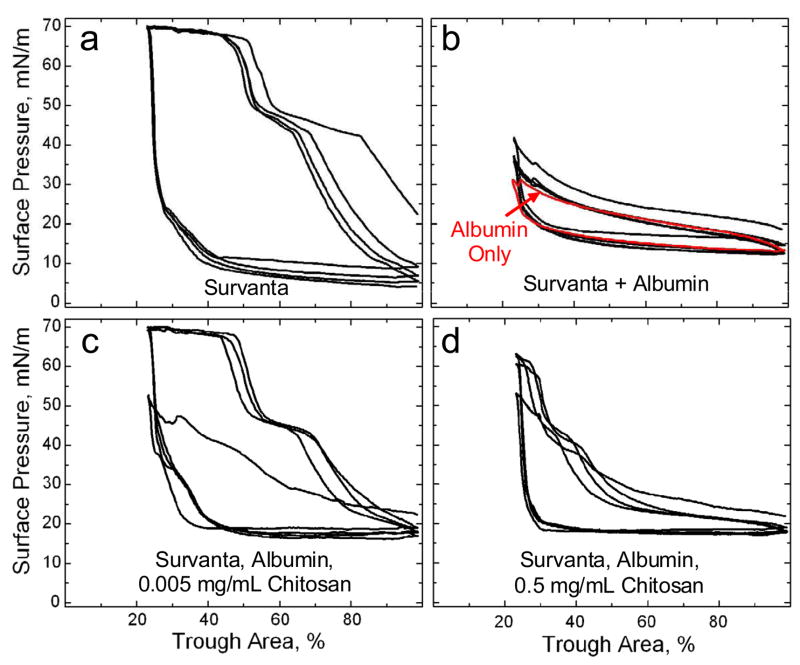
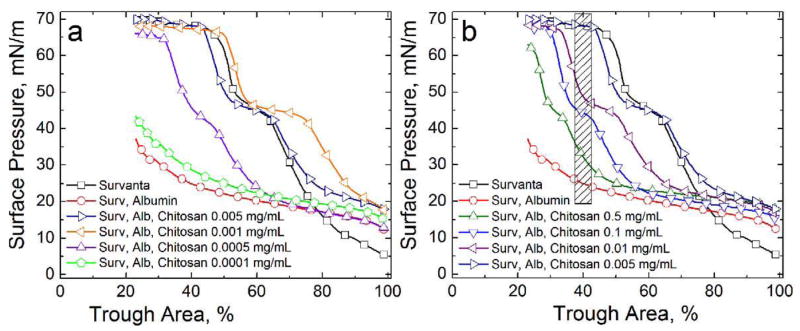
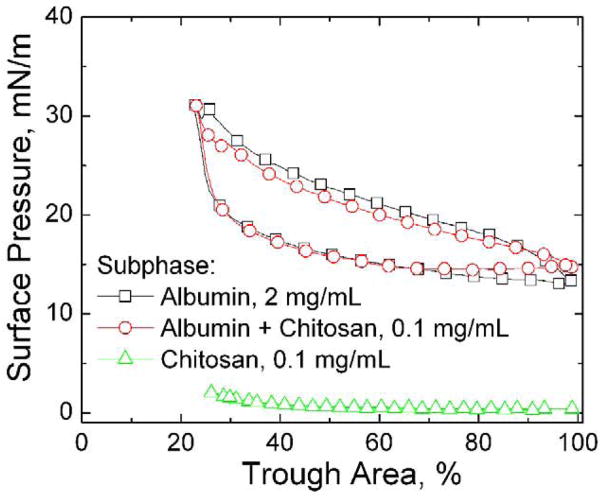
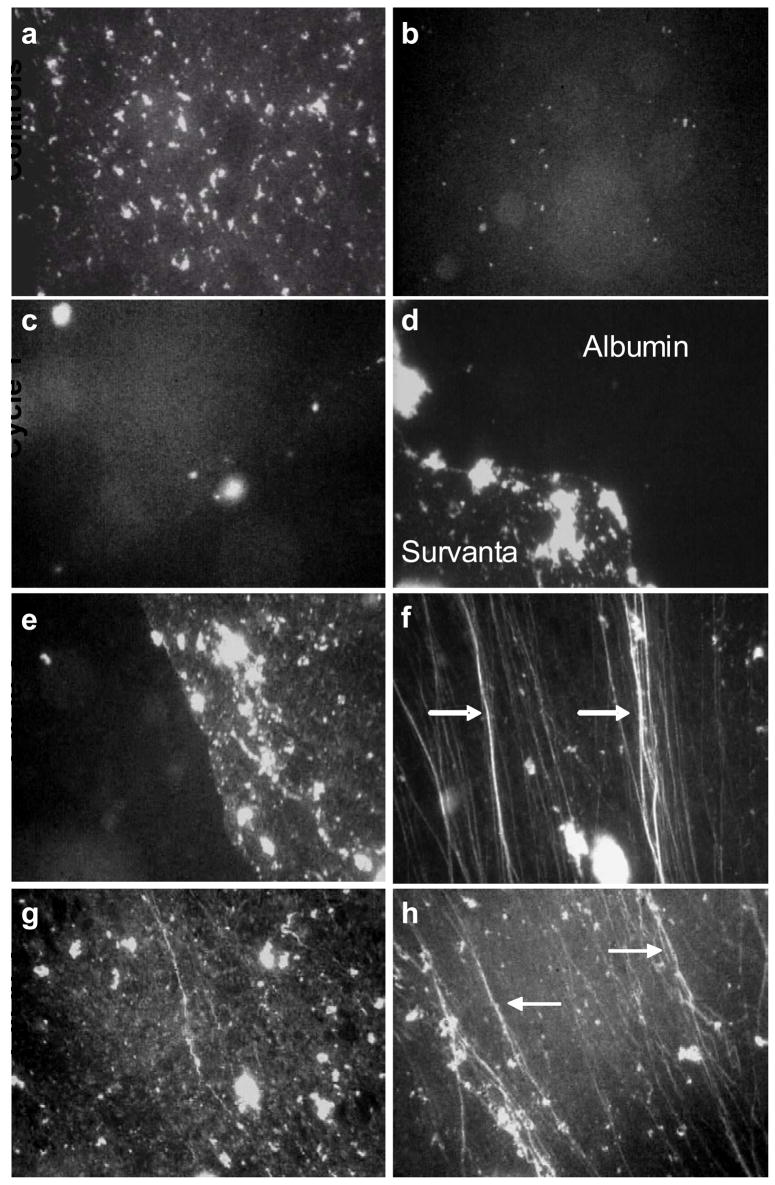
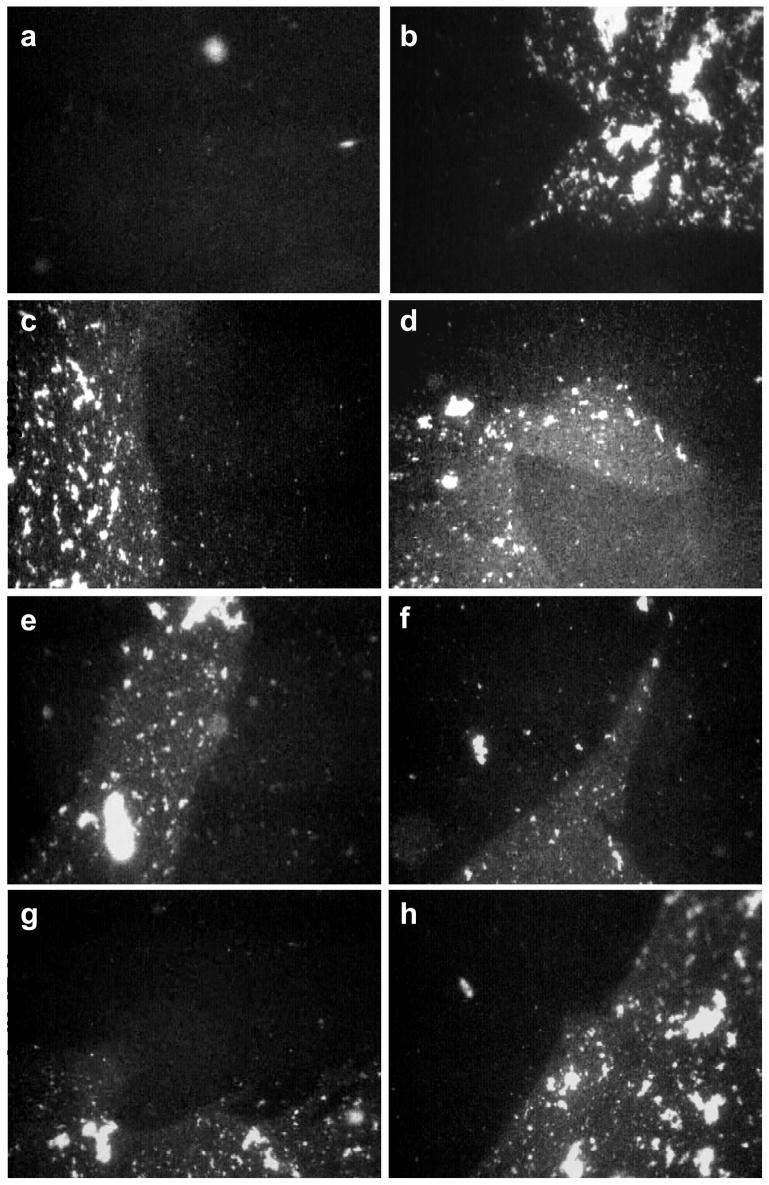
Chitosan, a naturally occurring cationic polyelectrolyte, restores the adsorption of the clinical lung surfactant Survanta to the air-water interface in the presence of albumin at much lower concentrations than uncharged polymers such as polyethylene glycol. This is consistent with the positively charged chitosan forming ion pairs with negative charges on the albumin and lung surfactant particles, reducing the net charge in the double-layer, and decreasing the electrostatic energy barrier to adsorption to the air-water interface. However, chitosan, like other polyelectrolytes, cannot perfectly match the charge distribution on the surfactant, which leads to patches of positive and negative charge at net neutrality. Increasing the chitosan concentration further leads to a reduction in the rate of surfactant adsorption consistent with an over-compensation of the negative charge on the surfactant and albumin surfaces, which creates a new repulsive electrostatic potential between the now cationic surfaces. This charge neutralization followed by charge inversion explains the window of polyelectrolyte concentration that enhances surfactant adsorption; the same physical mechanism is observed in flocculation and re-stabilization of anionic colloids by chitosan and in alternate layer deposition of anionic and cationic polyelectrolytes on charged colloids.


Figures

Figure 1
Figure 1
(a) Cyclic isotherms of 800 μg Survanta deposited from an aqueous buffer onto a saline-buffered subphase containing no albumin or chitosan. On compression, the isotherm exhibits a characteristic shoulder at 45 mN/m and a collapse plateau at Πmax ~ 69 mN/m. On expansion, the surface pressure drops rapidly, reaching a minimum surface pressure of ~5–10 mN/m until compression is resumed. (b) Black curve: 800 μg Survanta added to a saline-buffered subphase containing 2 mg/mL albumin. The characteristic shoulder and collapse plateau on compression seen in (a) cannot be reached with albumin in the subphase regardless of the compression. Red Curve: The isotherm of a subphase containing 2 mg/ml albumin, with no added Survanta or chitosan. The two curves trace over each other, indicating that the interfacial film is dominated by albumin and that Survanta is not adsorbing to the interface. (c) 800 μg Survanta deposited on a subphase containing 2 mg/ml albumin and 0.005 mg/mL chitosan. By the second compression cycle, the characteristic shoulder and collapse plateau have been restored at similar trough areas as in (a) showing that the presence of 0.005 mg/mL chitosan completely reverses the surfactant adsorption inhibition. The only difference with the Survanta isotherms in Fig. 1a is that the minimum surface pressure in the presence of albumin never drops below about 15 mN/m on full expansion, which corresponds to the equilibrium spreading pressure of the albumin. (d) 800 μg Survanta deposited on a subphase containing 2 mg/ml albumin and 0.5 mg/mL chitosan. At high trough areas, the isotherm resembles that of albumin (Fig. 1b), while at low trough areas, the characteristic shoulder is evident as in Fig. 1a. However, the isotherm only reaches a surface pressure of ~ 60 and the collapse plateau does not form at the limiting compression. This indicates that the increased chitosan concentration decreases surfactant adsorption compared to Fig. 1c.
Figure 2
Figure 2
Fourth cycle compression isotherms of 800 μg Survanta on a saline buffered subphase containing albumin (2 mg/mL when present) and the stated chitosan concentrations. (a) □ Survanta; ○ Survanta-albumin; ▷ Survanta-albumin with 0.005 mg/mL chitosan, ◁ Survanta-albumin with 0.001 mg/mL chitosan; △ Survanta-albumin with 0.0005 mg/mL chitosan; ⬠ Survanta-albumin with 0.0001 mg/mL chitosan. In this concentration regime, increasing chitosan concentration yields increasing surfactant adsorption. From Table 1, charge neutralization of the Survanta and albumin is reached between 0.0005–0.005 mg/mL chitosan. Note that for .001 mg/ml chitosan, more Survanta adsorbs (isotherm shifted to larger trough areas) that the control Survanta on a clean subphase. (b) □ Survanta; ○ Survanta-albumin; △ Survanta-albumin-chitosan 0.5 mg/mL, ▽ Survanta-albumin-chitosan 0.1 mg/mL; ◁ Survanta-albumin-chitosan 0.01 mg/mL; ▷ Survanta-albumin-chitosan 0.005 mg/mL. For chitosan concentrations greater than that necessary for charge neutralization (Table 1), surfactant adsorption decreased. The shaded area denotes the trough area over which the surface pressure was averaged for each chitosan concentration to obtain the surfactant relative adsorption plotted in Fig. 6.
Figure 3
Figure 3
Fourth cycle compression isotherms of subphases containing albumin and/or chitosan without Survanta. □ 2 mg/mL albumin; ○ 2 mg/mL albumin-0.1 mg/mL chitosan; △ 0.1 mg/mL chitosan. Albumin is surface active while chitosan is not; chitosan addition does not change the albumin isotherm. Compressing the albumin film increases the surface pressure from about 15 mN/m to a maximum of about 30 mN/m; expanding the albumin film shows a similar hysteresis to the Survanta monolayer as the surface pressure rapidly drops to < 20 mN/m and is roughly constant during the expansion. This minimum surface pressure is likely set by adsorption of albumin from solution.
Figure 4
Figure 4
Fluorescence images of 800 μg Survanta (doped with 1% mol Texas Red DHPE) spread at varying subphase compositions. The albumin was not labeled, does not fluoresce and appears black in the images. Images are 1023 μm by 789 μm; all images are from the compression part of the isotherm. (a) Survanta on a clean, buffered subphase at Π = 43 mN/m. The image shows the mottled texture typical of a phase separated lipid/protein monolayer. The bright spots are Survanta aggregates partially adsorbed to the interface and partially in solution. (b) Survanta on a subphase containing 2 mg/mL albumin at Π = 25 mN/m. The isolated bright spots on a homogeneous black background shows that Survanta aggregates come close to the interface, but cannot spread due to the albumin film at the interface. The albumin effectively prevents Survanta from adsorbing to the interface. The remaining images show Survanta on a subphase containing 2 mg/mL albumin and 0.005 mg/mL chitosan during successive compression/expansion cycles. First Cycle: (c) Π = 25 mN/m. The isolated bright spots on a homogenous black background shows that Survanta aggregates cannot easily spread due to the albumin film at the interface. (d) Π = 54 mN/m. Survanta breaks through the interface; extended (>1000 μm) immiscible Survanta (mottled gray) and albumin (black) domains coexist on the interface. The surface pressure needed to remove albumin from the interface is much greater than the 15 – 20 mN/m equilibrium spreading pressure of albumin. Second Cycle: (e) Π = 43 mN/m. Continued coexistence between Survanta and albumin domains (f) Π = 69 mN/m. At the collapse plateau, only Survanta is present in the film; the images are dominated by the cracks and folds (arrows) typical of monolayer collapse. As suggested by a recent theoretical model, the collapse folds are roughly parallel to each other and are perpendicular to the compression direction [52]. Several smaller folds have coalescesced into the brighter white, larger folds at the arrows, also as suggested by theory [52]. Third Cycle: (g) Π = 43 mN/m. Once albumin is removed from the interface, the film morphology is identical to Survanta on a buffered subphase and albumin does not re-adsorb to the interface under these conditions. (h) Π = 69 mN/m. The arrows indicate brighter collapse cracks and folds at which smaller folds have coalesced [52].
Figure 5
Figure 5
Fluorescence images of 800 μg Survanta spread on a saline buffered subphase containing 2 mg/mL albumin and 0.5 mg/mL chitosan. Images are 1023 μm by 789 μm. First Cycle (a) Π = 25 mN/m during compression. The black homogenous background dominates the interface as the albumin prevents the Survanta from spreading as a monolayer. (b) Π = 18 mN/m during expansion. Survanta breaks through the interface; extended (>1000 μm) immiscible Survanta (mottled gray) and albumin (black) domains coexist on the interface. Second Cycle (c) Π = 21 mN/m during compression. (d) Π = 18 mN/m during expansion. The albumin and Survanta domains coexist during the compression and expansion cycle. Third Cycle (e) Π = 21 mN/m during compression. (f) Π = 18 mN/m during expansion. Albumin and Survanta domains coexist on the interface. Fourth Cycle (g) Π = 24 mN/m during compression. (h) Π = 18 mN/m during expansion. Albumin remains on the interface through the fourth compression and expansion cycle. Apparently a sufficient quantity of Survanta does not adsorb to completely expel the albumin from the interface.
Figure 6
Figure 6
Relative adsorption (RA) of 800 μg Survanta on subphases containing 2 mg/mL albumin at varying chitosan concentrations. □ Survanta-albumin-chitosan; ○ Survanta-albumin, which as been plotted at a chitosan concentration of 7×10⁻⁵ mg/mL for comparison purposes. RA is the difference between the sample surface pressure (Π) and the surface pressure of the albumin only isotherm (ΠAlb, red curve in Fig. 1b), divided by the difference between the clean interface isotherm (no albumin), ΠSat, and ΠAlb, RA=ΠΠAlbΠSatΠAlbA0. All surface pressures were evaluated by averaging over the same trough area, A0, denoted by the shaded area in Fig. 2. The relative adsorption increases with chitosan concentration to an optimum value of RA ~ 1 at .001 – 0.005 mg/mL chitosan and then decreases with subsequent increases in chitosan concentration. The dashed box indicates the calculated (Table 1) chitosan concentration range where n+/n = 1 (0.0005–0.005 mg/mL). The optimum RA occurs in this chitosan concentration range consistent with a chitosan neutralizing the negative surface charge on the albumin and surfactant, thereby eliminating the electrostatic energy barrier to surfactant adsorption. Higher chitosan concentrations above n+/n = 1 lead to charge reversal as excess chitosan adsorbs to the albumin and surfactant, leading to a net positive charge in the double layer and a restored energy barrier to adsorption (Eqn. 1–3).

References

    1. Clements JA, Avery ME. Lung surfactant and neonatal respiratory distress syndrome. American Journal of Respiratory and Critical Care Medicine. 1998;157:S59–S66. - PubMed
    1. Notter R. Lung surfactant: basic science and clinical applications. Vol. 149. Marcel Dekker; New York: 2000.
    1. Rubenfeld GD, Caldwell E, Peabody E, Weaver J, Martin DP, Neff M, Stern EJ, Hudson LD. Incidence and outcomes of acute lung injury. New England Journal of Medicine. 2005;353:1685–1693. - PubMed
    1. Perez-Gil J. Structure of pulmonary surfactant membranes and films: the role of proteins and lipid-protein interactions. Biochimica et Biophysica acta (BBA)-Biomembranes. 2008;1778:1676–1695. - PubMed
    1. Schmidt R, Markart P, Ruppert C, Wygrecka M, Kuchenbuch T, Walmrath D, Seeger W, Guenther A. Time-dependent changes in pulmonary surfactant function and composition in acute respiratory distress syndrome due to pneumonia or aspiration. Respiratory Research. 2007;8:55. - PMC - PubMed

Publication types

LinkOut - more resources