. 2009 Apr 21;106(16):6808-13.
doi: 10.1073/pnas.0902063106. Epub 2009 Apr 6.

Daily rhythms of food-anticipatory behavioral activity do not require the known circadian clock

Affiliations

Daily rhythms of food-anticipatory behavioral activity do not require the known circadian clock

Kai-Florian Storch et al. Proc Natl Acad Sci U S A. .

Abstract

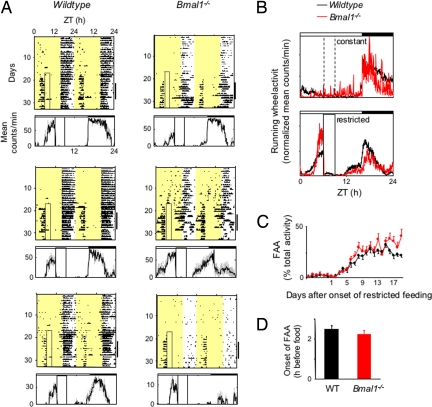
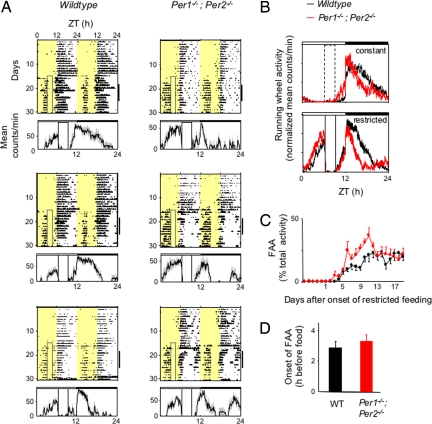
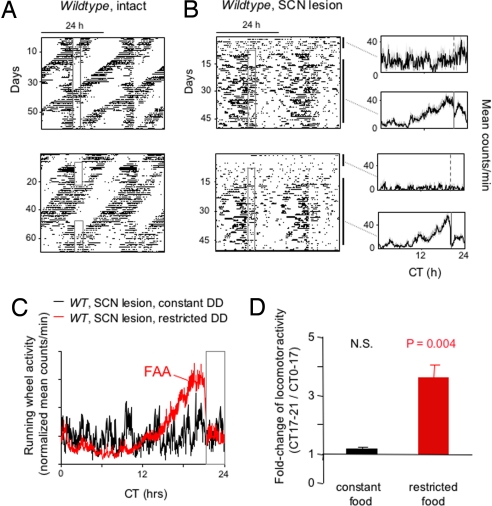
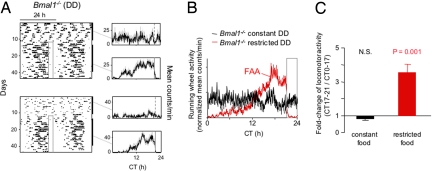
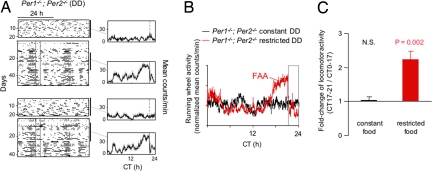
When food availability is restricted to a particular time each day, mammals exhibit food-anticipatory activity (FAA), a daily increase in locomotor activity preceding the presentation of food. Considerable historical evidence suggests that FAA is driven by a food-entrainable circadian clock distinct from the master clock of the suprachiasmatic nucleus. Multiple food-entrainable circadian clocks have been discovered in the brain and periphery, raising strong expectations that one or more underlie FAA. We report here that mutant mice lacking known circadian clock function in all tissues exhibit normal FAA both in a light-dark cycle and in constant darkness, regardless of whether the mutation disables the positive or negative limb of the clock feedback mechanism. FAA is thus independent of the known circadian clock. Our results indicate either that FAA is not the output of an oscillator or that it is the output of a circadian oscillator different from known circadian clocks.


Conflict of interest statement

The authors declare no conflict of interest.

Figures

Fig. 1.
Fig. 1.
Normal FAA in Bmal1−/− mice. (A) Representative double-plotted actograms of daily running-wheel activity of 3 Bmal1−/− mice and 3 wild-type littermates (as indicated) during constant food availability and under subsequent temporal restricted feeding. The boxed area toward the left side of each actogram indicates the daily interval of food availability under temporal food restriction, and yellow areas indicate time of lights-on (16:8 light–dark cycle in these experiments). Under a light–dark cycle, Bmal1−/− mice show a diurnal variation in locomotor activity because of the acute suppressive effect of light on the behavior (masking). For clarity, the 4-day gradual narrowing of the interval of food availability is not included in the boxed area (Fig. S1). The graphs below each plot show the profile of daily running-wheel activity for each animal, averaged across 7 days during temporal food restriction (marked by the black bar on the right of each actogram). Gray vertical lines represent ± SEM. A similar FAA was observed with Bmal1−/− mice in a 12:12 light–dark cycle. ZT, Zeitgeber time. (B) Mean locomotor activity profiles of Bmal1−/− mice and wild-type littermates (n = 10 for each genotype) under constant food availability (Upper) and after subsequent temporal food restriction (Lower). Individual mean 7-day profiles have been normalized by total daily activity so that each animal contributes equally to the shape of the profile; each data point represents normalized counts per minute averaged across a 6-min bin (mean ± SEM). Time of light–dark cycle is indicated by white (light) and black (dark) bars at the top of each panel. Broken vertical lines (Upper) indicate, for comparison, the daily interval corresponding to subsequent restricted food availability; solid vertical lines (Lower) indicate the daily interval of food availability under temporal food restriction. (C) Time course of the development of FAA in Bmal1−/− mice (n = 22) and wild-type littermates (n = 20). Shown is the daily percentage of running-wheel activity (mean ± SEM) allocated to a 3-h time interval, ZT3–6. After 4 days of a gradually narrowing window of food availability, the final temporal food restriction started on day 1 (food available from ZT6–9). (D) Number of hours by which FAA anticipated daily food availability in Bmal1−/− mice and wild-type littermates (n = 20 for each genotype). For each animal, the running-wheel activity profile was averaged over 7 consecutive days during stable temporal food restriction (as in B), and the average time of onset of FAA was defined as the time before food presentation at which the FAA peak rose to its half-maximum (mean ± SEM). The difference between genotypes is not statistically significant.
Fig. 2.
Fig. 2.
Normal FAA in Per1−/−; Per2−/− double-mutant mice. (A) Representative double-plotted actograms of daily running-wheel activity of 3 wild-type and 3 Per1−/−; Per2−/− mice (as indicated) during constant food availability and under subsequent temporal food restriction. Data are displayed as in Fig. 1A. Under a light–dark cycle, Per1−/−; Per2−/− mice show a diurnal variation in locomotor activity because of the acute suppressive effect of light on behavior. (B) Mean locomotor activity profiles of wild-type (n = 9) and Per1−/−; Per2−/− mice (n = 8) under constant food availability (Upper) and after subsequent temporal food restriction (Lower). Data are displayed as in Fig. 1B. (C) Time course of the development of FAA in wild-type and Per1−/−; Per2−/− mice (n = 8 for each genotype). Data are displayed as in Fig. 1C. (D) Number of hours by which FAA anticipated daily food availability in wild-type and Per1−/−; Per2−/− mice (n = 8 for each genotype). Data are displayed as in Fig. 1D. The difference between genotypes is not statistically significant.
Fig. 3.
Fig. 3.
Detection of FAA in constant darkness in behaviorally arrhythmic mice with prominent ultradian activity. (A) Representative double-plotted actograms of daily running-wheel activity of 2 wild-type mice (C57BL/6) during constant food availability and under temporal food restriction in constant darkness. Actograms are displayed as in Fig. 1A. (B) (Left) Representative double-plotted actograms of daily running-wheel activity of 2 SCN-lesioned wild-type mice (C57BL/6) during constant food availability and under subsequent temporal food restriction in constant darkness. Actograms are displayed as in Fig. 1A. (Right) Profile of daily running-wheel activity averaged across the days marked by the associated black bars to the right of each actogram, one during constant food availability and one during subsequent temporal food restriction. Gray vertical lines represent ± SEM. CT indicates circadian time (time of day during constant darkness conditions). (C) Mean locomotor activity profiles of SCN-lesioned wild-type mice (n = 7) during constant food availability (black) and after subsequent temporal food restriction (red), calculated as in Fig. 1B. Gray open box at right indicates the daily interval of food availability under temporal food restriction (CT21–24). (D) Quantification of FAA in SCN-lesioned mice in constant darkness (n = 7). Shown is the fold change of locomotor activity (running-wheel counts per minute; mean ± SEM) in each mouse for CT17–21 (when FAA would be expected under restricted food availability, see C) compared with CT0–17 (the rest of the day, except for CT21–24, the time when food was available under food restriction conditions). This latter interval was omitted from the computations because of the acute suppressive effect of food presentation on running-wheel activity (e.g., red trace in C). Under temporal food restriction, increased running-wheel activity (counts per minute) during CT17–21 compared with CT0–17 was highly significant (paired t test), but there was no significant difference under constant food access. N.S., not significant.
Fig. 4.
Fig. 4.
Normal FAA in Bmal1−/− mice in constant darkness. (A) Representative double-plotted actograms of daily running-wheel activity of 2 Bmal1−/− mice during constant food availability and under subsequent temporal food restriction in constant darkness. Data are displayed as in Fig. 3B. Note arrhythmic, ultradian activity before temporal food restriction. (B) Mean locomotor activity profiles of Bmal1−/− mice (n = 7) during constant food availability (black) and after subsequent temporal food restriction (red), displayed as in Fig. 3C. (C) Quantification of FAA in Bmal1−/− mice (n = 7) in constant darkness. Data are displayed as in Fig. 3D.
Fig. 5.
Fig. 5.
Normal FAA in Per1−/−; Per2−/− double-mutant mice in constant darkness. (A) Representative double-plotted actograms of daily running-wheel activity of 2 Per1−/−; Per2−/− mice during constant food availability and under temporal food restriction in constant darkness. Data are displayed as in Fig. 3B. Note arrhythmic, ultradian activity before temporal food restriction. (B) Mean locomotor activity profiles of Per1−/−; Per2−/− mice (n = 8) during constant food availability (black) and after subsequent temporal food restriction (red). Data are displayed as in Fig. 3C. (C) Quantification of FAA in Per1−/−; Per2−/− mice (n = 8) in constant darkness. Data are displayed as in Fig. 3D.

References

    1. Mistlberger RE. Circadian food-anticipatory activity: Formal models and physiological mechanisms. Neurosci Biobehav Rev. 1994;18:171–195. - PubMed
    1. Stephan FK. Food entrainable oscillators in mammals. In: Takahashi JS, Turek FW, Moore RY, editors. Circadian Clocks, Handbook of Behavioral Neurobiology. Vol 12. New York: Kluwer Academic/Plenum; 2001. pp. 223–246.
    1. Pittendrigh CS. Circadian systems: General perspective. In: Aschoff J, editor. Biological Rhythms, Handbook of Behavioral Neurobiology. Vol 4. New York: Kluwer Academic/Plenum; 1981. pp. 57–80.
    1. Coleman GJ, Harper S, Clarke JD Armstrong S. Evidence for a separate meal-associated oscillator in the rat. Physiol Behav. 1982;29:107–115. - PubMed
    1. Stephan FK, Swann JM, Sisk CL. Anticipation of 24-hr feeding schedules in rats with lesions of the suprachiasmatic nucleus. Behav Neural Biol. 1979;25:346–363. - PubMed

Publication types

MeSH terms

Substances