. 2009 Jun 12;284(24):16400-16408.
doi: 10.1074/jbc.M901201200. Epub 2009 Apr 14.

Function of a subunit isoforms of the V-ATPase in pH homeostasis and in vitro invasion of MDA-MB231 human breast cancer cells

Affiliations

Function of a subunit isoforms of the V-ATPase in pH homeostasis and in vitro invasion of MDA-MB231 human breast cancer cells

Ayana Hinton et al. J Biol Chem. .

Abstract

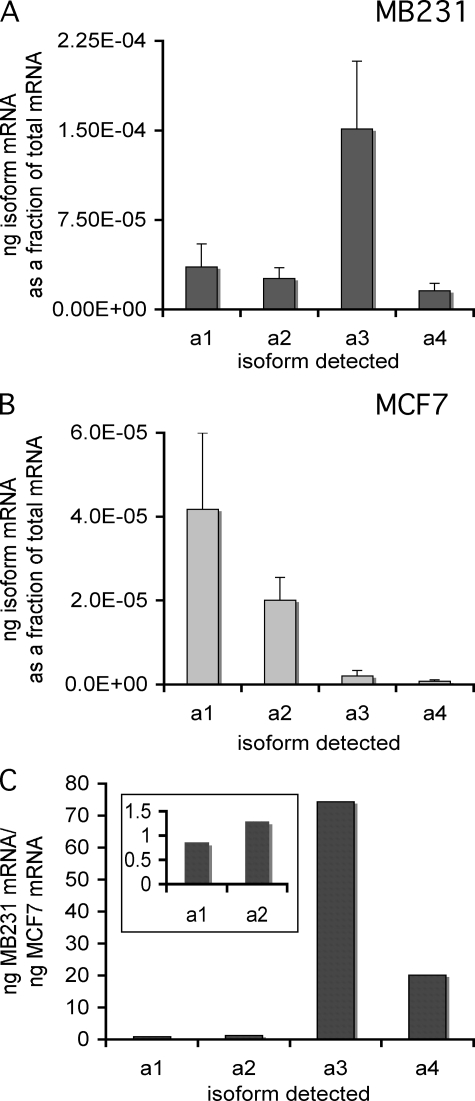
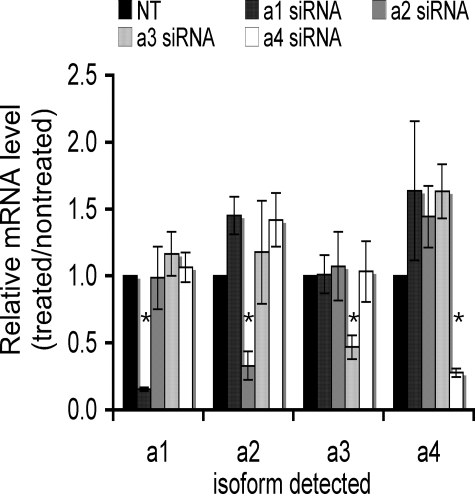
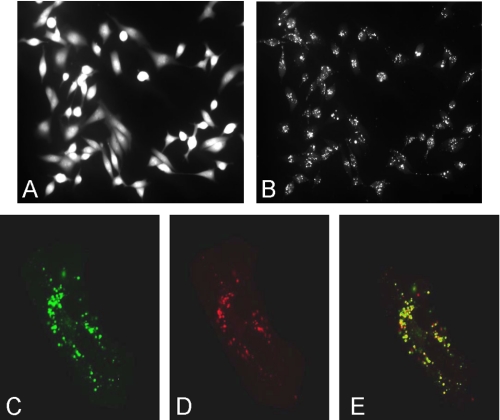
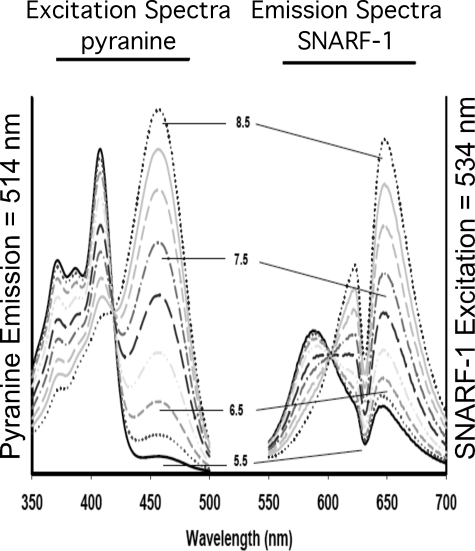
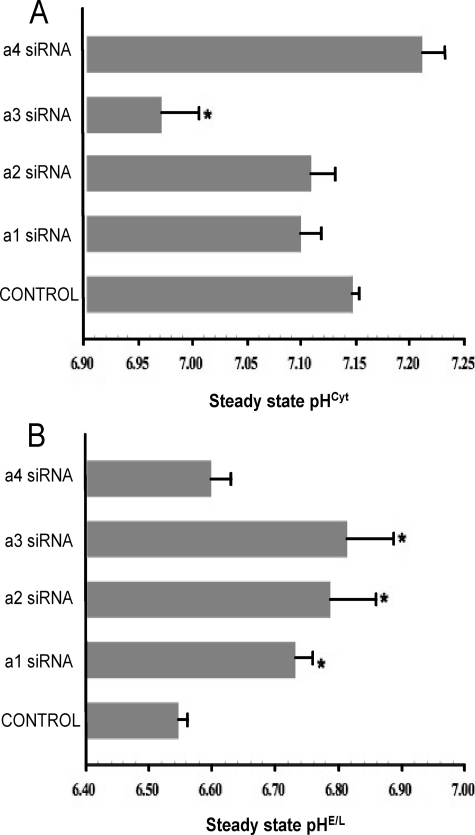
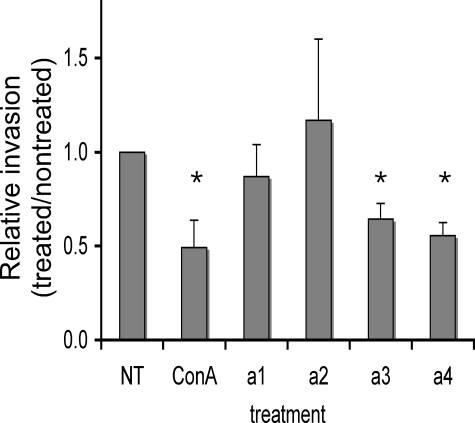
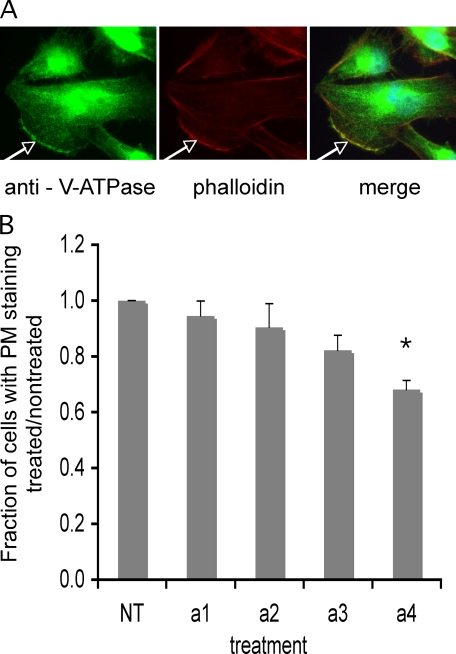
It has previously been shown that highly invasive MDA-MB231 human breast cancer cells express vacuolar proton-translocating ATPase (V-ATPases) at the cell surface, whereas the poorly invasive MCF7 cell line does not. Bafilomycin, a specific V-ATPase inhibitor, reduces the in vitro invasion of MB231 cells but not MCF7 cells. Targeting of V-ATPases to different cellular membranes is controlled by isoforms of subunit a. mRNA levels for a subunit isoforms were measured in MB231 and MCF7 cells using quantitative reverse transcription-PCR. The results show that although all four isoforms are detectable in both cell types, levels of a3 and a4 are much higher in MB231 than in MCF7 cells. Isoform-specific small interfering RNAs (siRNA) were employed to selectively reduce mRNA levels for each isoform in MB231 cells. V-ATPase function was assessed using the fluorescent indicators SNARF-1 and pyranine to monitor the pH of the cytosol and endosomal/lysosomal compartments, respectively. Cytosolic pH was decreased only on knockdown of a3, whereas endosome/lysosome pH was increased on knockdown of a1, a2, and a3. Treatment of cells with siRNA to a4 did not affect either cytosolic or endosome/lysosome pH. Measurement of invasion using an in vitro transwell assay revealed that siRNAs to both a3 and a4 significantly inhibited invasion of MB231 cells. Immunofluorescence staining of MB231 cells for V-ATPase distribution revealed extensive intracellular staining, with plasma membrane staining observed in approximately 18% of cells. Knockdown of a4 had the greatest effect on plasma membrane staining, leading to a 32% reduction. These results suggest that the a4 isoform may be responsible for targeting V-ATPases to the plasma membrane of MB231 cells and that cell surface V-ATPases play a significant role in invasion. However, other V-ATPases affecting the pH of the cytosol and intracellular compartments, particularly those containing a3, are also involved in invasion.


Figures

FIGURE 1.
FIGURE 1.
mRNA levels of subunit a isoforms in MB231 and MCF7 cells. Using mRNA isolated from cells, quantitative RT-PCR was used to determine the mRNA levels of the different subunit a isoforms, as described under “Experimental Procedures.” Plasmids expressing the cDNA for each isoform were used to construct a standard curve. All values are normalized to total mRNA loaded as determined by Quant-iT RiboGreen® reagent. The values reported are the ratio of nanograms of isoform-specific mRNA to the total nanograms of mRNA. A, a subunit isoform-specific mRNA levels in MB231 cells. B, a subunit isoform-specific mRNA levels in MCF7 cells. C, ratio of a subunit isoform-specific mRNAs in MB231 versus MCF7 cells. Inset shows data for a1 and a2 on an expanded scale. n = 7, error bars indicate standard deviation.
FIGURE 2.
FIGURE 2.
Isoform specificity of mRNA knockdown using a subunit isoform-specific siRNAs. siRNA pools from Dharmacon were used to reduce the mRNA levels of each isoform in MB231 cells as described under “Experimental Procedures.” The level of knockdown was quantitated by performing QRT-PCR on RNA from cells harvested 96 h siRNA post-treatment. Knockdown is reported as the ratio of the nanograms of mRNA in treated cells versus the nanograms of mRNA in nontreated (NT) cells as determined using the standard curve after QRT-PCR. Values are means; error bars indicate standard deviation, n = 5. *, p < 0.01 versus nontreated.
FIGURE 3.
FIGURE 3.
Fluorescent pH indicators in cytosol and endosomes/lysosomes. MB231 cells were loaded with 1 mm 8-hydroxypyrene-1,3,6-risulfonic acid (pyranine), to label endosomes/lysosomes or 7 μm of the acetoxymethyl ester form of SNARF-1 to label the cytosol as described under “Experimental Procedures.” A, fluorescence image of cells loaded with SNARF-1, excited at 534 nm, and the fluorescence emission signal collected at 590 nm (long bandpass filter). B, same field as for A, except that pyranine was excited at 465 nm and its emission collected at 514 nm (20 nm bandpass). C–E, cells incubated with pyranine as in A were washed to remove extracellular pyranine and further incubated with 2 μm LysoTracker® Red DND-99 for 3 min to label endosomes/lysosomes. C, cells were transferred to the microscope chamber, and the fluorescence of pyranine was excited at 458 nm and the emission collected from 514 to 540 nm. D, fluorescence of LysoTracker® Red was excited at 543 nm, and the emission was collected from 580 to 650 nm. E shows the merge of C and D and indicates that these fluoroprobes exhibit significant co-localization.
FIGURE 4.
FIGURE 4.
Spectral properties and pH dependence of fluorescence of SNARF-1 and pyranine. 1 μm pyranine and 2 μm SNARF-1 (free acid) were dissolved in high K+ buffer and spectral properties evaluated as follows. The excitation spectra of pyranine were collected using an emission wavelength of 514 nm, whereas the emission spectra of SNARF-1 were acquired using 534 nm as the excitation wavelength. Note that these fluoroprobes do not exhibit spectral overlap and do not exhibit fluorescence resonance energy transfer that could hamper the interpretation of the data. For pyranine, an increase in the excitation peak at 465 nm and a decrease at 405 nm as pH is increased from 5.5 to 8.5 is observed. 415 nm represents the isoexcitation wavelength and is used to evaluate dye concentration and/or quenching artifacts. For SNARF-1, the emission signal at 644 nm decreases and at 584 nm increases as pH is decreased. 600 nm represents the isoemissive wavelength. Consequently, the fluorescence ratios at 465/405 and 644/584 nm can be used to monitor pH in endosomes/lysosomes and cytosol, respectively, using a ratiometric approach that allows quantitation of pH.
FIGURE 5.
FIGURE 5.
Steady state pH of cytosol and endosomes/lysosomes in MB231 cells treated with a subunit isoform-specific siRNAs. Cells that had been treated with siRNA directed against a1, a2, a3, or a4 or no siRNA (Control) were incubated as described under “Experimental Procedures” followed by loading of endosomes/lysosomes with pyranine or cytosol with SNARF-1, as described. 96 h post-transfection, simultaneous measurements of pHcyt and pHE/L were performed in cells co-loaded with pyranine and SNARF-1 as described under “Experimental Procedures.” The conversion of ratio values to pHcyt and pHE/L were performed as described previously. Values are means, and error bars indicate standard deviation, n = 6. *, p < 0.05 versus control.
FIGURE 6.
FIGURE 6.
In vitro invasion of MB231 cells after siRNA treatment. In vitro invasion was assayed using MatrigelTM-coated ChemoTx® membranes as described under “Experimental Procedures.” Cells treated with either concanamycin (ConA) or siRNA were allowed to invade and then stained with propidium iodide. Fourteen images were taken of the trans-side of the membrane in each well, and the number of cells per well were counted, and the average over three wells was calculated. Invasion is reported as the ratio of the amount of invasion observed for treated cells divided by the amount of invasion observed for nontreated cells. For concanamycin experiments, nontreated (NT) samples include an equivalent volume of the solvent (DMSO). Values are means, and error bars indicate standard deviation, n = 5. *, p < 0.01 versus nontreated.
FIGURE 7.
FIGURE 7.
Immunostaining of MB231 cells with antibody against the V-ATPase and quantitation of plasma membrane staining. MB231 cells were grown as a monolayer on coverslips inside 60-mm dishes. A wound was made through the monolayer to polarize the cells after which they were immunostained with an antibody directed against the E subunit of V-ATPase as described under “Experimental Procedures.” A, three panels show fluorescence using anti-E (left), phalloidin to stain actin filaments (middle), and the merge (right), respectively. White arrows indicate the leading edge. B, cells grown as described above were treated with siRNA against the four a subunit isoforms, allowed to reach confluence, wounded, and immunostained as described under “Experimental Procedures.” Thirty to 40 consecutive images were captured along the wound. For each image, the total number of cells was counted, and the number showing a distinct line of staining at the plasma membrane (as indicated by the white arrow) was counted. The data are presented as a fraction of cells with plasma membrane staining relative to nontreated. Values are means; error bars indicate standard deviation, n = 3. *, p < 0.01 versus nontreated.
FIGURE 8.
FIGURE 8.
Secretion of cathepsin L by MB231 cells. MB231 cells were treated with siRNA against the four a subunit isoforms or no siRNA (nontreated) for 24 h, and the media were then replaced with media without siRNA. The cells were incubated for an additional 48 h in serum-containing media and 24 h in serum-free media, and then conditioned media from these cells were collected and analyzed for the presence of pro-cathepsin L by Western blotting using a commercially available antibody as described under “Experimental Procedures.” Shown is a representative result.

References

    1. Gupta G. P., Massagué J. ( 2006) Cell 127, 679– 695 - PubMed
    1. Pantel K., Brakenhoff R. H. ( 2004) Nat. Rev. Cancer 4, 448– 456 - PubMed
    1. Forgac M. ( 2007) Nat. Rev. Mol. Cell Biol. 8, 917– 929 - PubMed
    1. Ohta T., Numata M., Yagishita H., Futagami F., Tsukioka Y., Kitagawa H., Kayahara M., Nagakawa T., Miyazaki I., Yamamoto M., Iseki S., Ohkuma S. ( 1996) Br. J. Cancer 73, 1511– 1517 - PMC - PubMed
    1. Kubota S., Seyama Y. ( 2000) Biochem. Biophys. Res. Commun. 278, 390– 394 - PubMed

Publication types

MeSH terms