. 2009 May 1;69(9):4059-66.
doi: 10.1158/0008-5472.CAN-09-0164. Epub 2009 Apr 14.

Identification of potential driver genes in human liver carcinoma by genomewide screening

Affiliations

Identification of potential driver genes in human liver carcinoma by genomewide screening

Hyun Goo Woo et al. Cancer Res. .

Abstract

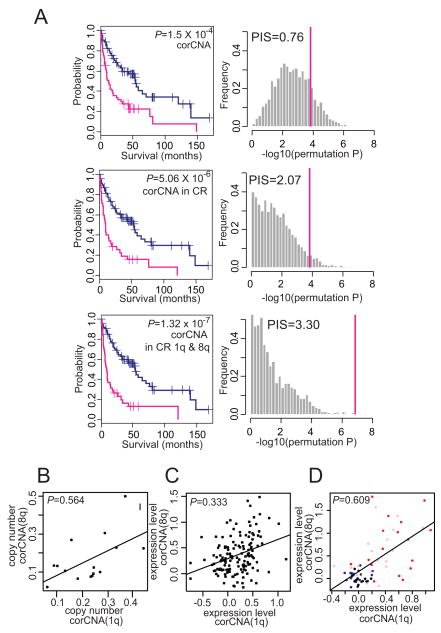
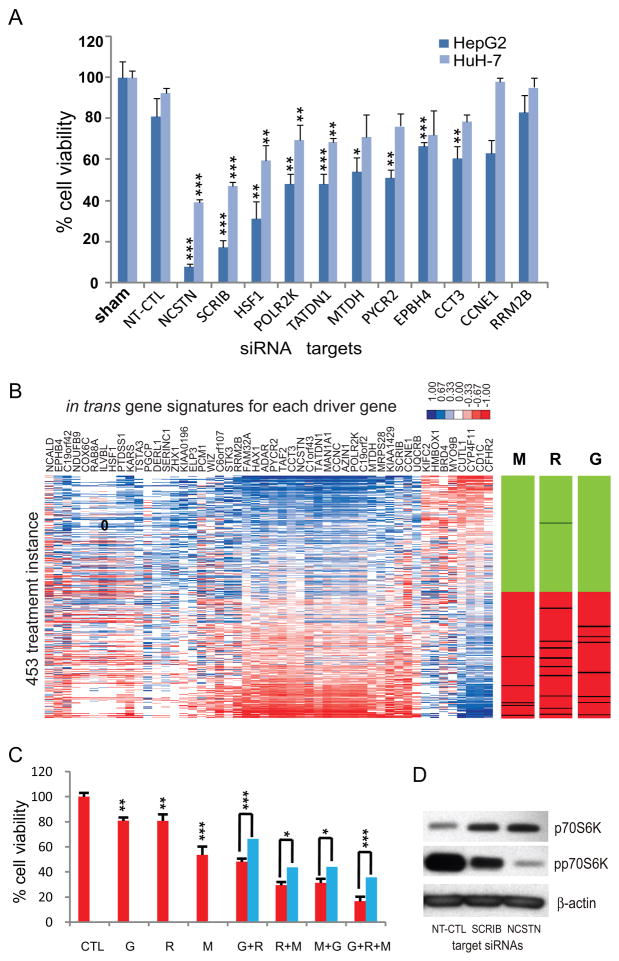
Genomic copy number aberrations and corresponding transcriptional deregulation in the cancer genome have been suggested to have regulatory roles in cancer development and progression. However, functional evaluation of individual genes from lengthy lists of candidate genes from genomic data sets presents a significant challenge. Here, we report effective gene selection strategies to identify potential driver genes based on systematic integration of genome scale data of DNA copy numbers and gene expression profiles. Using regional pattern recognition approaches, we discovered the most probable copy number-dependent regions and 50 potential driver genes. At each step of the gene selection process, the functional relevance of the selected genes was evaluated by estimating the prognostic significance of the selected genes. Further validation using small interference RNA-mediated knockdown experiments showed proof-of-principle evidence for the potential driver roles of the genes in hepatocellular carcinoma progression (i.e., NCSTN and SCRIB). In addition, systemic prediction of drug responses implicated the association of the 50 genes with specific signaling molecules (mTOR, AMPK, and EGFR). In conclusion, the application of an unbiased and integrative analysis of multidimensional genomic data sets can effectively screen for potential driver genes and provides novel mechanistic and clinical insights into the pathobiology of hepatocellular carcinoma.


Figures

Figure 1
Figure 1
Identification of genomic regional patterns of DNA copy numbers and mRNA expression in HCC. A, T-statistic map (TM ) was constructed based on one-sample T-statistic values of the copy numbers in 15 HCCs with moving window size 100 Kb. B, Gene expression profiles of 139 HCC samples in the order of chromosomal location. C, Transcriptome correlation map (TCM) for the gene expression profiles of 139 HCC. Thresholds for TM (29.9) and TCM (28.7) were determined by 100 random permutation tests.
Figure 2
Figure 2
Prognostic impacts of T-statistic map (TM) or transcriptome correlation map (TCM) regions. A, Kaplan-Meir plot analyses (left) and prognostic impact scores (PIS)(right) of the genes located in the TM, TCM, and CR regions are shown, respectively. To show the significance of the PIS, the distribution of log-rank test P-values generated from 2,000 random datasets (Pm) were plotted with the log-rank test P-values calculated from the selected gene sets (P0, red line). B, Kaplan-Meir plot analyses and log-rank tests for overall survival and recurrence free survival (C) in the HCC subgroups based on expression similarities of the genes located in the CR1, CR3, CR13, and CR20.
Figure 3
Figure 3
Correlation of gene copy numbers and transcriptional levels. A, Kaplan-Meir plot analyses (left) and prognostic impact scores (PIS) (right) of 379 (top), 50 (middle), and 30 (bottom) Correlated copy number alteration (corCNA) genes are shown, respectively. B, scatter plot for the average copy numbers of the corCNA genes at 1q vs. 8q in 15 HCC dataset. C-D, Scatter plots for the average gene expression levels of corCNA genes at 1q vs. 8q in 139 HCC (C) and GSE6764 dataset (D). Pathological phenotypes of cirrhotic liver (n = 13, black), dysplastic nodules (n = 17, blue), early HCC (n = 18, pink), and advanced HCC (n = 17, red) are indicated with different colors in D. The significance of the correlation coefficients was evaluated by 10,000 random permutation test (P = 0.042, P = 0.005, respectively).
Figure 4
Figure 4
Evaluation of functional and clinical utility of the 50 in trans correlated genes. A, The siRNAs (15 nM) targeting 11 driver genes were transfected to HepG2 and HuH-7 cells for 96 hrs, and the cell viabilities were assessed by MTT [3-(4,5-dimethylthiazol-2-yl)-2,5-diphenyltetrazolium bromide] assay. Non-targeting control siRNA(NT-CTL) was used as a control. Each bar indicates mean percentage cell viability of three replicates compared to NT-CTL. Error bars represent mean ± SD. Significance of growth inhibition compared to NT-CTL for each cell line was evaluated by two-sample T-test (* P <0.05, ** P < 0.01, and *** P < 0.001). B, Connectivity scores for each of the in trans correlated gene signatures to Connectivity Map are shown in a heatmap ordered by the average connectivity scores for individual instances (Savg). Bar-views with the instances of metformin (M, n = 5), rapamycin (R, n = 10), and EGFR/IR selective tyrosine kinase inhibitors (i.e., gefitinib, 4,5-dianilinophthalimide, butein, tyrophostin AG-1478, and HNMPA-(AM)3) (G, n = 7). Ranked distribution of Savg for the interesting perturbagen is indicated as a black line in the ordered 453 instances. Other instances with positive and negative connectivity scores are indicated with green and red color, respectively. C, HuH-7 cells were treated with rapamycin (R, 10 nM), metformin (M, 1 mM), or gefitinib (G, 1 μM) for 48 hrs in serum free media, and the cell viability was assessed by MTT ([3-(4,5-dimethylthiazol-2-yl)-2,5-diphenyltetrazolium bromide] assay. The % cell viability of three replicates compared to the control group (red bar) and the expected viability of combination treatment (blue bar) are indicated. Error bars indicate mean ± SD. Significance of the growth inhibition effects compared to the control or expected value E were evaluated by two-sample T-test (*P<0.05, **P<0.01, and ***P<0.001). D, HuH-7 cells were transfected with siRNAs (15 nM) targeting NCSTN or SCRIB for 48 hrs, and Western blot analysis was performed using antibodies for p70 S6 kinase (p70S6K), phospho-p70 S6 kinase (pp70S6K), and β-actin.

References

    1. Lee JS, Chu IS, Heo J, et al. Classification and prediction of survival in hepatocellular carcinoma by gene expression profiling. Hepatology. 2004;40:667–76. - PubMed
    1. Wurmbach E, Chen YB, Khitrov G, et al. Genome-wide molecular profiles of HCV-induced dysplasia and hepatocellular carcinoma. Hepatology. 2007;45:938–47. - PubMed
    1. Ye QH, Qin LX, Forgues M, et al. Predicting hepatitis B virus-positive metastatic hepatocellular carcinomas using gene expression profiling and supervised machine learning. Nat Med. 2003;9:416–23. - PubMed
    1. Lee JS, Heo J, Libbrecht L, et al. A novel prognostic subtype of human hepatocellular carcinoma derived from hepatic progenitor cells. Nat Med. 2006;12:410–6. - PubMed
    1. Paris PL, Andaya A, Fridlyand J, et al. Whole genome scanning identifies genotypes associated with recurrence and metastasis in prostate tumors. Hum Mol Genet. 2004;13:1303–13. - PubMed

Publication types