

Quantitative metrics of net proliferation and invasion link biological aggressiveness assessed by MRI with hypoxia assessed by FMISO-PET in newly diagnosed glioblastomas
- PMID: 19366800
- PMCID: PMC3760276
- DOI: 10.1158/0008-5472.CAN-08-3884
Quantitative metrics of net proliferation and invasion link biological aggressiveness assessed by MRI with hypoxia assessed by FMISO-PET in newly diagnosed glioblastomas
Abstract
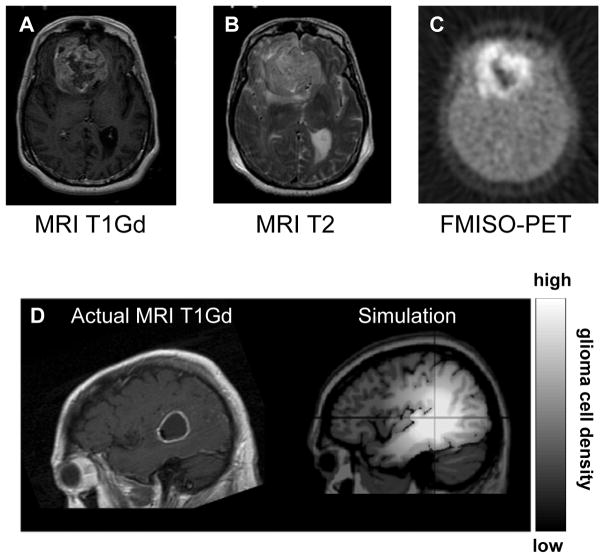
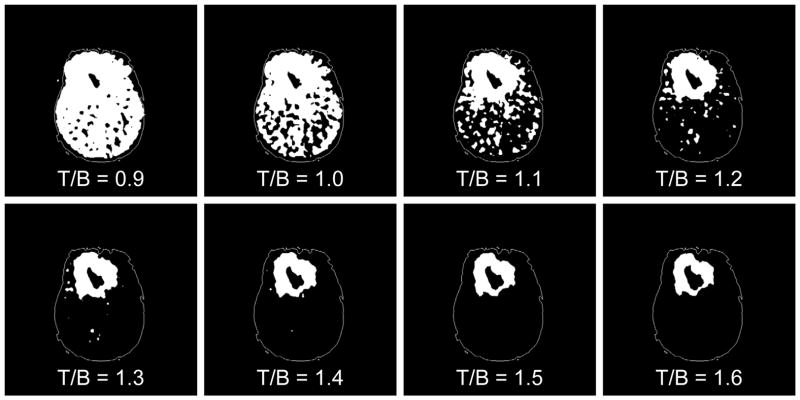
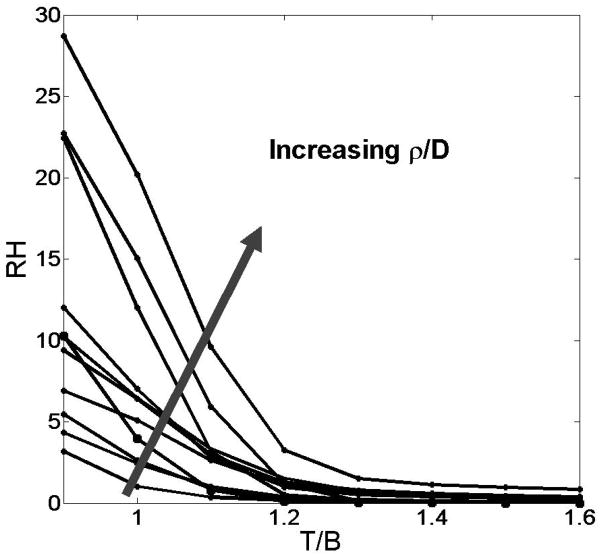
Glioblastoma multiforme (GBM) are aggressive and uniformly fatal primary brain tumors characterized by their diffuse invasion of the normal-appearing parenchyma peripheral to the clinical imaging abnormality. Hypoxia, a hallmark of aggressive tumor behavior often noted in GBMs, has been associated with resistance to therapy, poorer survival, and more malignant tumor phenotypes. Based on the existence of a set of novel imaging techniques and modeling tools, our objective was to assess a hypothesized quantitative link between tumor growth kinetics [assessed via mathematical models and routine magnetic resonance imaging (MRI)] and the hypoxic burden of the tumor [assessed via positron emission tomography (PET) imaging]. Our biomathematical model for glioma kinetics describes the spatial and temporal evolution of a glioma in terms of concentration of malignant tumor cells. This model has already been proven useful as a novel tool to dynamically quantify the net rates of proliferation (rho) and invasion (D) of the glioma cells in individual patients. Estimates of these kinetic rates can be calculated from routinely available pretreatment MRI in vivo. Eleven adults with GBM were imaged preoperatively with (18)F-fluoromisonidazole (FMISO)-PET and serial gadolinium-enhanced T1- and T2-weighted MRIs to allow the estimation of patient-specific net rates of proliferation (rho) and invasion (D). Hypoxic volumes were quantified from each FMISO-PET scan following standard techniques. To control for tumor size variability, two measures of hypoxic burden were considered: relative hypoxia (RH), defined as the ratio of the hypoxic volume to the T2-defined tumor volume, and the mean intensity on FMISO-PET scaled to the blood activity of the tracer (mean T/B). Pearson correlations between RH and the net rate of cell proliferation (rho) reached significance (P < 0.04). Moreover, highly significant positive correlations were found between biological aggressiveness ratio (rho/D) and both RH (P < 0.00003) and the mean T/B (P < 0.0007).
Figures

References
-
- Stupp R, Mason WP, van den Bent MJ, et al. Radiotherapy plus concomitant and adjuvant temozolomide for glioblastoma. N Engl J Med. 2005;352:987–96. - PubMed
-
- Stupp R, Hegi ME, Gilbert MR, Chakravarti A. Chemoradiotherapy in malignant glioma: standard of care and future directions. J Clin Oncol. 2007;25:4127–36. - PubMed
-
- Silbergeld DL, Rostomily RC, Alvord EC., Jr The cause of death in patients with glioblastoma is multifactorial: clinical factors and autopsy findings in 117 cases of supratentorial glioblastoma in adults. J Neurooncol. 1991;10:179–85. - PubMed
-
- Mankoff DA, Peterson LM, Tewson TJ, et al. [18F]fluoroestradiol radiation dosimetry in human PET studies. J Nucl Med. 2001;42:679–84. - PubMed
Publication types
MeSH terms
Substances
Grants and funding
LinkOut - more resources
Full Text Sources
Other Literature Sources
Medical
