. 2009 Jul;58(7):1499-508.
doi: 10.2337/db08-1571. Epub 2009 Apr 14.

Sensitivity of lipid metabolism and insulin signaling to genetic alterations in hepatic peroxisome proliferator-activated receptor-gamma coactivator-1alpha expression

Affiliations

Sensitivity of lipid metabolism and insulin signaling to genetic alterations in hepatic peroxisome proliferator-activated receptor-gamma coactivator-1alpha expression

Jennifer L Estall et al. Diabetes. 2009 Jul.

Abstract

Objective: The peroxisome proliferator-activated receptor-gamma coactivator (PGC)-1 family of transcriptional coactivators controls hepatic function by modulating the expression of key metabolic enzymes. Hepatic gain of function and complete genetic ablation of PGC-1alpha show that this coactivator is important for activating the programs of gluconeogenesis, fatty acid oxidation, oxidative phosphorylation, and lipid secretion during times of nutrient deprivation. However, how moderate changes in PGC-1alpha activity affect metabolism and energy homeostasis has yet to be determined.

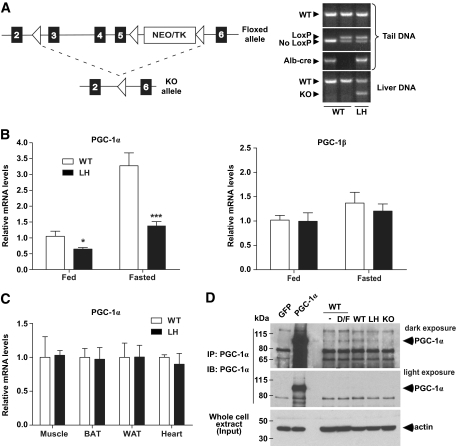
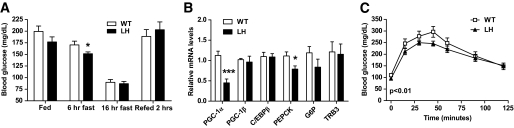
Research design and methods: To identify key metabolic pathways that may be physiologically relevant in the context of reduced hepatic PGC-1alpha levels, we used the Cre/Lox system to create mice heterozygous for PGC-1alpha specifically within the liver (LH mice).

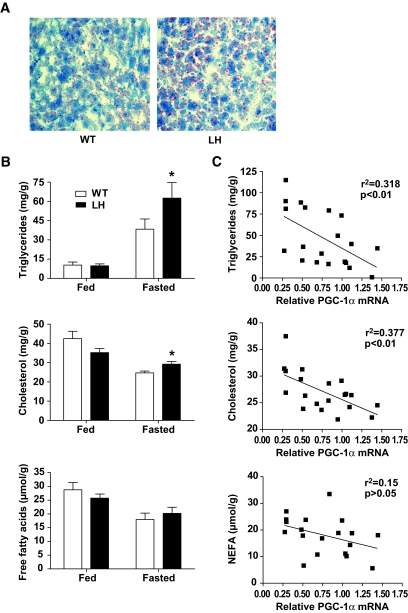
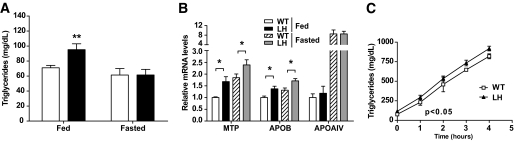
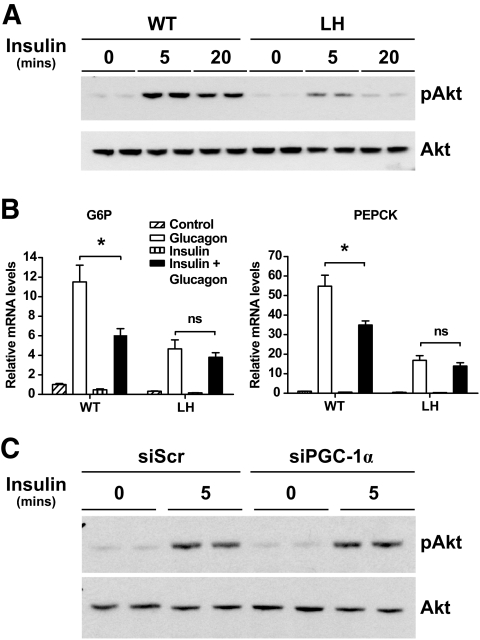
Results: These mice showed fasting hepatic steatosis and diminished ketogenesis associated with decreased expression of genes involved in mitochondrial beta-oxidation. LH mice also exhibited high circulating levels of triglyceride that correlated with increased expression of genes involved in triglyceride-rich lipoprotein assembly. Concomitant with defects in lipid metabolism, hepatic insulin resistance was observed both in LH mice fed a high-fat diet as well as in primary hepatocytes.

Conclusions: These data highlight both the dose-dependent and long-term effects of reducing hepatic PGC-1alpha levels, underlining the importance of tightly regulated PGC-1alpha expression in the maintenance of lipid homeostasis and glucose metabolism.


Figures

FIG. 1.
FIG. 1.
Generation and characterization of liver-specific PGC-1α heterozygous (LH) mice. A: Mice were bred to carry one floxed PGC-1α allele and transgenically express Cre recombinase under control of the rat albumin promoter, leading to excision of exons 3–5 of PGC-1α within the liver. △, LoxP sites. PCR analysis detected the presence of the LoxP sites (floxed allele), alb-cre transgene, and knockout allele. B and C: Relative mRNA expression of either PGC-1α or PGC-1β in liver (B) and in muscle, BAT, WAT, and heart tissue (C) from LH versus control (wild-type [WT]) mice. D: Endogenous PGC-1α was immunoprecipitated from primary hepatocyte protein extracts isolated from wild-type, LH, and whole-body PGC-1α knockout animals (KO) to show relative protein expression. Immunoprecipitates from cultured hepatocytes treated with dexamethasone/forskolin (D/F) and adenovirally overexpressed PGC-1α demonstrate anti–PGC-1α antibody specificity. *P < 0.05; ***P < 0.001. GFP, green fluorescent protein.
FIG. 2.
FIG. 2.
Accumulation of hepatic lipids in fasted LH mice. A: Oil red O staining of liver sections isolated from 24-h–fasted mice. B: Average triglyceride, cholesterol, and NEFA levels in fed or 24-h–fasted wild-type (WT) and LH livers after chloroform/methanol lipid extraction, n = 6 (fed) or 9–10 (fasted) mice per group. C: Individual fasted lipid concentrations were plotted against the relative PGC-1α mRNA value for each mouse and subjected to linear regression analysis. *P < 0.05. (A high-quality digital representation of this figure is available in the online issue.)
FIG. 3.
FIG. 3.
Reduced fatty acid oxidation gene expression and function in LH mice. A and B: Affected (A) and unaffected (B) genes. Hepatic mRNA levels were quantified by RT-PCR in mice fed ad libitum or fasted overnight. Bars represent the means ± SE (n = 6) and are expressed relative to wild-type (WT) fed values. C: mRNA expression levels, expressed relative to green fluorescent protein (GFP)-infected control, from primary hepatocytes overexpressing PGC-1α. Values are the means ± SD of triplicate values, representative of three individual experiments. D: 14C-palmitate oxidation in wild-type and LH primary hepatocytes. Values are the means ± SD of quadruplicate values. E: Serum ketones. The concentration of β-hydroxybutyrate in serum of fed or 24-h–fasted mice is shown. Data are the means ± SE (n = 11). F: Concentrations of individual acyl-CoA metabolites isolated from 24-h–fasted livers, as determined by mass spectrometry. Data are the means ± SE (n = 9–10). *P < 0.05; **P < 0.01; ***P < 0.001. AOX, acyl-CoA oxidase; SBCAD, short/branched-chain acyl-CoA dehydrogenase.
FIG. 4.
FIG. 4.
LH mice exhibit increased circulating triglycerides and altered expression of genes involved in VLDL production. A: Concentrations of circulating triglycerides in fed or 24-h–fasted mice. Data are the means ± SE (n = 11). □, Wild-type; ■, LH. B: Lipid transport genes. Hepatic mRNA levels were quantified by RT-PCR in mice fed or fasted overnight. Data are the means ± SE (n = 6). Values are expressed relative to wild-type (WT) fed levels. C: Time–course of serum triglyceride accumulation after inhibition of lipolysis with intravenously injected Tyloxapol. Values are the means ± SE (n = 3) and are representative of two independent experiments. P < 0.05 by two-way ANOVA. *P < 0.05; **P < 0.01.
FIG. 5.
FIG. 5.
Decreased insulin signaling in primary LH hepatocytes. Levels of phosphorylated Akt (pAkt) and total Akt were measured in protein extracts from primary wild-type (WT) or LH hepatocytes (A) or wild-type hepatocytes infected with either siPGC-1α or control virus (C) treated with media alone (control) or 100 nmol/l insulin for the indicated time points. Western blots show biological duplicates and are representative of two individual experiments. B: Gluconeogenic gene expression in wild-type and LH hepatocytes after pretreatment with media (control) or 100 nmol/l insulin for 10 min before addition of vehicle or 25 nmol/l glucagon, as indicated. Values are the means ± SD and representative of two individual experiments. *P < 0.05. ns, nonsignificant; siScr, scrambled siRNA.
FIG. 6.
FIG. 6.
High-fat–fed LH mice exhibit hepatic insulin resistance. A: Relative levels of PGC-1α mRNA isolated from livers of wild-type (WT) and LH mice fed either a regular chow or high-fat diet (HFD) for 16 weeks. Bars represent the means ± SE (n = 6) and are expressed relative to values for wild-type mice fed regular chow. B: Average weight of wild-type and LH mice on high-fat diet for 6 weeks. Data are the means ± SE (n = 10). C: Western blot of phosphorylated Akt (pAkt) and total Akt in hepatic protein extracts from high-fat diet–fed wild-type or LH mice after intravenous injection of PBS (−) or insulin (+). D and E: Circulating insulin (D) and hepatic mRNA expression (E) levels in high-fat diet–fed mice fasted overnight or fasted mice refed for 2 h. Data are the means ± SE expressed relative to wild-type fasted levels (n = 6–14). F: Hepatic mRNA levels in high-fat–fed wild-type and LH mice. Data are the means ± SE (n = 6), expressed relative to wild-type levels. *P < 0.05; **P < 0.01. Hsp90, 90-kDa heat shock protein.
FIG. 7.
FIG. 7.
Fasting hypoglycemia and deficient gluconeogenesis in LH mice fed a high-fat diet. A: Blood glucose levels in fed, fasted (6 or 16 h), or refed (fasted overnight and refed 2 h) wild-type (WT) or LH mice maintained on a high-fat diet for 6 weeks. Data are the means ± SE (n = 4–14). B: Hepatic mRNA levels in high-fat diet–fed wild-type and LH mice after a 24-h fast. Data are the means ± SE (n = 9, expressed relative to wild-type levels). C: Pyruvate tolerance test. Blood glucose levels were measured in 16-week high-fat diet–fed wild-type or LH mice after an overnight fast (time 0) and at the indicated times after an intraperitoneal injection of pyruvate (pyruvate tolerance test). Values represent the means ± SEM (n = 10), P < 0.01 by two-way ANOVA, indicating a significance difference between wild-type versus LH curves. *P < 0.05; ***P < 0.001.

Similar articles

Cited by

References

    1. Yeh MM, Brunt EM: Pathology of nonalcoholic fatty liver disease. Am J Clin Pathol 2007; 128: 837– 847 - PubMed
    1. Adiels M, Taskinen MR, Boren J: Fatty liver, insulin resistance, and dyslipidemia. Curr Diab Rep 2008; 8: 60– 64 - PubMed
    1. Staudinger JL, Lichti K: Cell signaling and nuclear receptors: new opportunities for molecular pharmaceuticals in liver disease. Mol Pharm 2008; 5: 17– 34 - PMC - PubMed
    1. Lin J, Handschin C, Spiegelman BM: Metabolic control through the PGC-1 family of transcription coactivators. Cell Metab 2005; 1: 361– 370 - PubMed
    1. Finck BN, Kelly DP: PGC-1 coactivators: inducible regulators of energy metabolism in health and disease. J Clin Invest 2006; 116: 615– 622 - PMC - PubMed

Publication types

MeSH terms