Paraneoplastic antigen-like 5 gene (PNMA5) is preferentially expressed in the association areas in a primate specific manner
- PMID: 19366867
- PMCID: PMC2774394
- DOI: 10.1093/cercor/bhp062
Paraneoplastic antigen-like 5 gene (PNMA5) is preferentially expressed in the association areas in a primate specific manner
Abstract
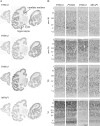
To understand the relationship between the structure and function of primate neocortical areas at a molecular level, we have been screening for genes differentially expressed across macaque neocortical areas by restriction landmark cDNA scanning (RLCS). Here, we report enriched expression of the paraneoplastic antigen-like 5 gene (PNMA5) in association areas but not in primary sensory areas, with the lowest expression level in primary visual cortex. In situ hybridization in the primary sensory areas revealed PNMA5 mRNA expression restricted to layer II. Along the ventral visual pathway, the expression gradually increased in the excitatory neurons from the primary to higher visual areas. This differential expression pattern was very similar to that of retinol-binding protein (RBP) mRNA, another association-area-enriched gene that we reported previously. Additional expression analysis for comparison of other genes in the PNMA gene family, PNMA1, PNMA2, PNMA3, and MOAP1 (PNMA4), showed that they were widely expressed across areas and layers but without the differentiated pattern of PNMA5. In mouse brains, PNMA1 was only faintly expressed and PNMA5 was not detected. Sequence analysis showed divergence of PNMA5 sequences among mammals. These findings suggest that PNMA5 acquired a certain specialized role in the association areas of the neocortex during primate evolution.
Figures


Similar articles
-
Retinol-binding protein gene is highly expressed in higher-order association areas of the primate neocortex.Cereb Cortex. 2005 Jan;15(1):96-108. doi: 10.1093/cercor/bhh112. Epub 2004 Jun 24. Cereb Cortex. 2005. PMID: 15217901
-
PNMA2 mediates heterodimeric interactions and antagonizes chemo-sensitizing activities mediated by members of PNMA family.Biochem Biophys Res Commun. 2016 Apr 22;473(1):224-229. doi: 10.1016/j.bbrc.2016.03.083. Epub 2016 Mar 19. Biochem Biophys Res Commun. 2016. PMID: 27003254
-
Binding and complementary expression patterns of semaphorin 3E and plexin D1 in the mature neocortices of mice and monkeys.J Comp Neurol. 2006 Nov 10;499(2):258-73. doi: 10.1002/cne.21106. J Comp Neurol. 2006. PMID: 16977617
-
Selective gene expression in regions of primate neocortex: implications for cortical specialization.Prog Neurobiol. 2011 Aug;94(3):201-22. doi: 10.1016/j.pneurobio.2011.04.008. Epub 2011 May 19. Prog Neurobiol. 2011. PMID: 21621585 Review.
-
Neocortical areas, layers, connections, and gene expression.Neurosci Res. 2006 May;55(1):11-27. doi: 10.1016/j.neures.2006.02.006. Epub 2006 Mar 20. Neurosci Res. 2006. PMID: 16546282 Review.
Cited by
-
Unearthing LTR Retrotransposon gag Genes Co-opted in the Deep Evolution of Eukaryotes.Mol Biol Evol. 2021 Jul 29;38(8):3267-3278. doi: 10.1093/molbev/msab101. Mol Biol Evol. 2021. PMID: 33871607 Free PMC article.
-
Modulator of apoptosis-1 is a potential therapeutic target in acute ischemic injury.J Cereb Blood Flow Metab. 2019 Dec;39(12):2406-2418. doi: 10.1177/0271678X18794839. Epub 2018 Aug 22. J Cereb Blood Flow Metab. 2019. PMID: 30132384 Free PMC article.
-
Revealing the Roles of MOAP1 in Diseases: A Review.Cells. 2022 Mar 4;11(5):889. doi: 10.3390/cells11050889. Cells. 2022. PMID: 35269511 Free PMC article. Review.
-
Unveiling the Role of PNMA2 in Endometriosis: From Proliferation and Apoptosis to Immunomodulation.J Cell Mol Med. 2025 May;29(9):e70576. doi: 10.1111/jcmm.70576. J Cell Mol Med. 2025. PMID: 40323214 Free PMC article.
-
Modulator of Apoptosis 1: A Highly Regulated RASSF1A-Interacting BH3-Like Protein.Mol Biol Int. 2012;2012:536802. doi: 10.1155/2012/536802. Epub 2012 Jun 14. Mol Biol Int. 2012. PMID: 22745908 Free PMC article.
References
-
- Abramoff MD, Magelhaes PJ, Ram SJ. Image processing with ImageJ. Biophotonics Int. 2004;11:36–42.
-
- Amir Y, Harel M, Malach R. Cortical hierarchy reflected in the organization of intrinsic connections in macaque monkey visual cortex. J Comp Neurol. 1993;334:19–46. - PubMed
-
- Andersen RA. Visual and eye movement functions of the posterior parietal cortex. Annu Rev Neurosci. 1989;12:377–403. - PubMed
-
- Baksh S, Tommasi S, Fenton S, Yu VC, Martins LM, Pfeifer GP, Latif F, Downward J, Neel BG. The tumor suppressor RASSF1A and MAP-1 link death receptor signaling to Bax conformational change and cell death. Mol Cell. 2005;18:637–650. - PubMed
Publication types
MeSH terms
Substances
LinkOut - more resources
Full Text Sources
Molecular Biology Databases

