. 2009 Aug;50(8):1641-52.
doi: 10.1194/jlr.M800590-JLR200. Epub 2009 Apr 14.

Ontogeny and nutritional control of adipogenesis in zebrafish (Danio rerio)

Affiliations

Ontogeny and nutritional control of adipogenesis in zebrafish (Danio rerio)

Edward J Flynn 3rd et al. J Lipid Res. 2009 Aug.

Abstract

The global obesity epidemic demands an improved understanding of the developmental and environmental factors regulating fat storage. Adipocytes serve as major sites of fat storage and as regulators of energy balance and inflammation. The optical transparency of developing zebrafish provides new opportunities to investigate mechanisms governing adipocyte biology, however zebrafish adipocytes remain uncharacterized. We have developed methods for visualizing zebrafish adipocytes in vivo by labeling neutral lipid droplets with Nile Red. Our results establish that neutral lipid droplets first accumulate in visceral adipocytes during larval stages and increase in number and distribution as zebrafish grow. We show that the cellular anatomy of zebrafish adipocytes is similar to mammalian white adipocytes and identify peroxisome-proliferator activated receptor gamma and fatty acid binding protein 11a as markers of the zebrafish adipocyte lineage. By monitoring adipocyte development prior to neutral lipid deposition, we find that the first visceral preadipocytes appear in association with the pancreas shortly after initiation of exogenous nutrition. Zebrafish reared in the absence of food fail to form visceral preadipocytes, indicating that exogenous nutrition is required for adipocyte development. These results reveal homologies between zebrafish and mammalian adipocytes and establish the zebrafish as a new model for adipocyte research.


Figures
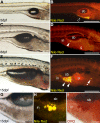
Fig. 1.
Fig. 1.
Nile Red staining reveals adipogenesis in developing zebrafish. Live zebrafish at 5, 8, or 15 dpf were stained with Nile Red and imaged using a GFP long-pass emission filter set. Bright-field (A, C, E, G) and corresponding fluorescence images (B, D, F, H) are shown. Nile Red fluorescence emission maxima is shifted to shorter wavelengths when incorporated into neutral lipid, so neutral lipid depots in yolk (black arrowhead in B) and adipocytes (white arrowheads in D and F) appear yellow. A, B: The yolk is the major neutral lipid depot in 5 dpf larvae. C, D: After yolk resorption, the first adipocyte neutral lipid droplets form in the right viscera by 8 dpf. E, F: By 15 dpf, adipocyte lipid droplets have increased in number within the viscera and also appear in other locations (asterisk in F). An individual 15 dpf zebrafish stained with Nile Red (G, H) and then stained with ORO (I) reveals colocalization of Nile Red and ORO staining in adipocyte neutral lipid droplets. Swim bladder (sb), gall bladder (g), and intestine (in) are indicated. Anterior is to the right and dorsal at the top in all images. Bars = 400 μm in A and B, 300 μm in C–F, and 100 μm in G–I.
Fig. 2.
Fig. 2.
Cellular anatomy of zebrafish adipocytes. Zebrafish were fixed at 28 dpf and processed for transmission electron microscopy. Toluidine blue-stained transverse section (A) and electron micrographs (B–E) show lipid droplets of varying sizes (asterisks) contained within adipocytes. Caveolae are indicated by black arrowheads in C. Swim bladder (sb), intestine (in), muscle (m), capillary (cp), red blood cells (rbc), and nuclei (nuc) are indicated. Bars = 100 μm in A, 1 μm in B, 200 nm in C, and 500 nm in D and E.
Fig. 3.
Fig. 3.
Zebrafish fat depots are mobilized in response to starvation and deposited in response to refeeding. Zebrafish were starved for 7 days beginning at 28 dpf and then refed for 4 days. Individual zebrafish were stained with Nile Red and imaged daily to monitor neutral lipid deposits (arrowheads in A and E). A–E depict an individual representative animal. A: Zebrafish fed normally through 28 dpf develop salient neutral lipid depots in the viscera (v), pectoral fin plate (pf), pericardial region (c), jaw (j), periorbital region (o), subcutaneous positions (s), and spinal column (sc). B: When starved for 4 days, neutral lipid depots were reduced in all locations, although the larger visceral and pectoral fin plate depots were the last to be exhausted. C: After 7 days of starvation, all neutral lipid depots were depleted. D, E: Refeeding for 1 day was sufficient to form transient neutral lipid deposits in the intestine (arrow in D), and refeeding for 4 days was sufficient to reestablish neutral lipid depots in the same locations as before starvation (arrowheads in A and E). Anterior is to the left and dorsal at the top in all images. F: To confirm these imaging results, we used the Folch method to extract and weigh total lipid from individual zebrafish at 28 dpf before starvation, at 35 dpf after 7 days of starvation, and at 39 dpf after 4 days of refeeding (6–9 individuals/group). Results are shown as mean ± SD (***, P < 0.0001; **, P < 0.001). Bar = 1 mm.
Fig. 4.
Fig. 4.
Zebrafish adipocytes express pparg and fabp11a. Individual zebrafish were stained with Nile Red at 15 dpf, imaged, and then processed for WISH using riboprobe directed against zebrafish pparg, fabp11a, or fabp11b mRNA. Cells labeled by WISH stain purple, in contrast to the brown melanin pigment contained within melanophores. Nile Red and WISH staining patterns were compared with detect colocalization. Whole-mount (A, B, D, E, G, H) and transverse cryosections (C, F) from the trunk of the same individuals are shown. Both fabp11a and pparg mRNA colocalize with neutral lipid droplets within visceral adipocytes associated with the pancreas (black arrowheads). fabp11a mRNA is also observed in nearby cells lacking neutral lipid droplets (putative preadipocytes; white arrows in E) and blood vessels (black arrows in E), while pparg mRNA is also found in the intestinal epithelium (black arrow in C). G, H: In contrast, visceral adipocytes containing neutral lipid droplets (black arrowheads in G) did not express fabp11b mRNA. Swim bladder (sb), gall bladder (gb), intestine (in), and pancreas (pan) are indicated. Dorsal is to the top in all panels and anterior to the right in A, B, D, and E. Bars = 100 μm in A, B, D, E, G, and H and 50 μm in C and F.
Fig. 5.
Fig. 5.
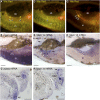
Expression pattern of fabp11a reveals development of zebrafish adipocyte lineage. Zebrafish were fixed and processed for WISH using fabp11a riboprobe at different stages to reveal the location of putative preadipocytes and adipocytes (black arrowheads). Cells expressing fabp11a mRNA stain purple, in contrast to the brown melanin pigment contained within melanophores. Images show whole 1 dpf (A) and 2 dpf embryos (B), trunk of 3 dpf showing fabp11a-expressing cells in the CHT (C), trunk of a 6 dpf larvae displaying visceral preadipocytes (D), transverse cryosection of a 6 dpf larvae showing pancreatic localization of a visceral preadipocyte (E), adipocytes in the trunk of a 10 dpf larvae (F), jaw (G), and trunk of a 28 dpf adult (H), transverse cryosection of a visceral adipocyte in a 28 dpf adult (I), and adipocytes in the caudal spinal column of a 28 dpf adult (J). Lens (le), diencephalon (di), blood vessels (black arrows), intestine (in), pancreas (pan), and heart (he) are indicated. Dorsal is to the top in all panels and anterior is to the left (A, B, C, H, J) or right (D, F). Bars = 200 μm in A–D, F, and G, 50 μm in E and I, and 400 μm in H and J.
Fig. 6.
Fig. 6.
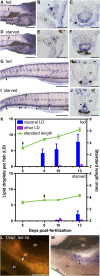
Zebrafish adipogenesis is regulated by exogenous nutrition. Whole-mount preparations (A, D, G, I) and transverse cryosections through the pancreas (B, E), heart (C, F), or CHT (H, J) of 8 dpf zebrafish that were either fed since 5 dpf (fed; A–C, G-H) or never fed (starved; D–F, I-J) and then processed for WISH using fabp11a riboprobe to reveal the location of preadipocytes (black arrowheads). Cells expressing fabp11a mRNA stain purple, in contrast to the brown melanin pigment contained within melanophores. Fed animals display fabp11a-expressing cells in the pancreas (A, B), whereas starved animals lack fabp11a-expressing cells in this location (D, E). In contrast, starved animals display supernumerary fabp11a-expressing cells in the heart (F) and CHT (I, J) compared with fed controls (C, G, H). Starved animals also displayed elevated fabp11a expression in the corpuscles of Stannius (white arrowhead in I) compared with fed controls (G). K: Zebrafish that were fed since 5 dpf (fed) or starved through 8 dpf and then fed normally (starved) were labeled with Nile Red at 5, 8, 10, and 13 dpf to permit enumeration of adipocyte neutral lipid droplets (LD) in the right viscera (visceral LD; blue bars in K) and other anatomic locations (other LD; purple bars in K). The left Y-axes show the total number of adipocyte neutral lipid droplets per fish, whereas the right Y-axes show SL measurements in millimeters (green lines in K). The black arrows in K mark the stage when animals began feeding. Data combined from two independent experiments are shown as mean ± 95% confidence intervals. L: Nile Red staining of a 13dpf zebrafish starved through 8 dpf and then fed for 5 days reveals a large neutral lipid droplet within a visceral adipocyte (white arrowhead in L). M: WISH of the same individual shows that fabp11a mRNA expression colocalizes with Nile Red staining (black arrowheads in M). A putative preadipocyte expressing fabp11a but lacking a large neutral lipid droplet is labeled with an asterisk in M. Blood vessels (black arrows), intestine (in), pancreas (p), myocardium (c), segmental muscle (m), notocord (nc), and swim bladder (sb) are indicated. Anterior is to the right and dorsal at the top in A, D, G, I, L, and M. Bars = 200 μm in A, D, G, and I, 50 μm in B, C, E, F, H, and J, and 100 μm in L and M.

Similar articles

Cited by

References

    1. Department of Health and Human Services (2001). The Surgeon General's Call to Action to Prevent and Decrease Overweight and Obesity. Public Health Service, Washington, DC
    1. Gesta S., Tseng Y. H., Kahn C. R. 2007. Developmental origin of fat: tracking obesity to its source. Cell. 131: 242–256 - PubMed
    1. Schlegel A., Stainier D. Y. 2007. Lessons from “lower” organisms: what worms, flies, and zebrafish can teach us about human energy metabolism. PLoS Genet. 3: e199. - PMC - PubMed
    1. Fruhbeck G., Gomez-Ambrosi J., Muruzabal F. J., Burrell M. A. 2001. The adipocyte: a model for integration of endocrine and metabolic signaling in energy metabolism regulation. Am. J. Physiol. Endocrinol. Metab. 280: E827–E847 - PubMed
    1. Macia L., Viltart O., Verwaerde C., Delacre M., Delanoye A., Grangette C., Wolowczuk I. 2006. Genes involved in obesity: adipocytes, brain and microflora. Genes Nutr. 1: 189–212 - PMC - PubMed

Publication types

MeSH terms