

Genetic markers and population history: Finland revisited
- PMID: 19367325
- PMCID: PMC2986642
- DOI: 10.1038/ejhg.2009.53
Genetic markers and population history: Finland revisited
Abstract
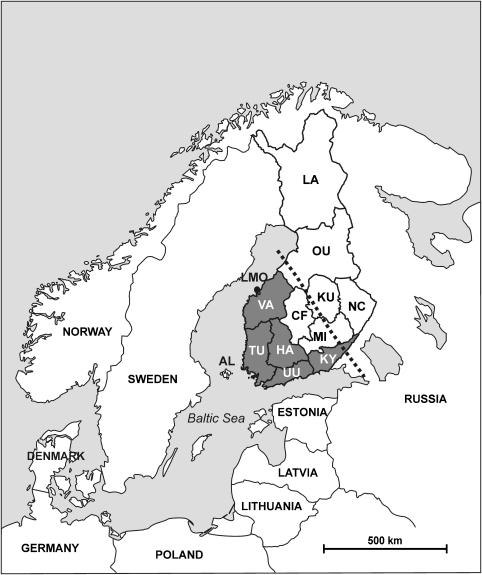
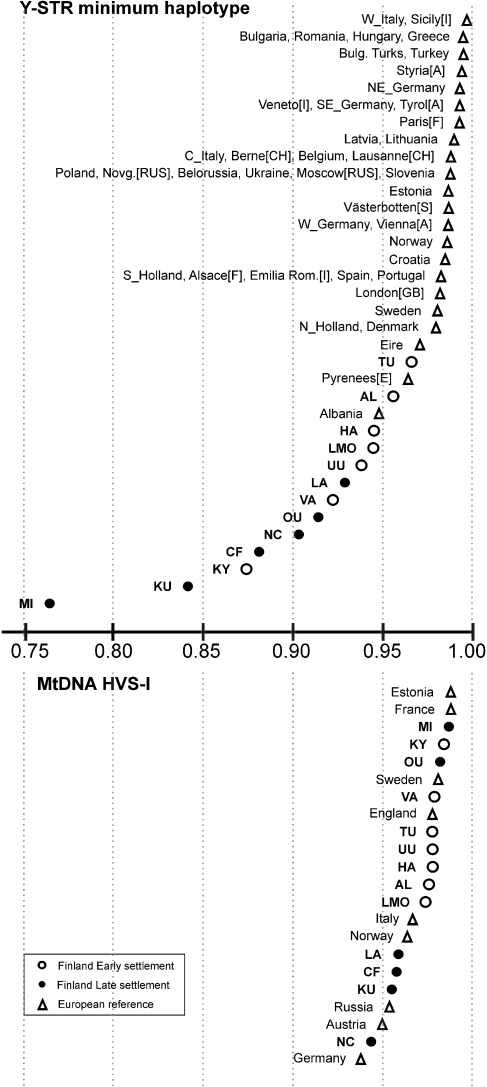
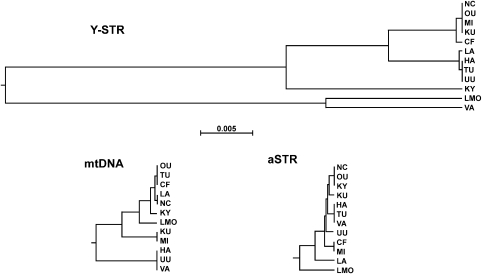
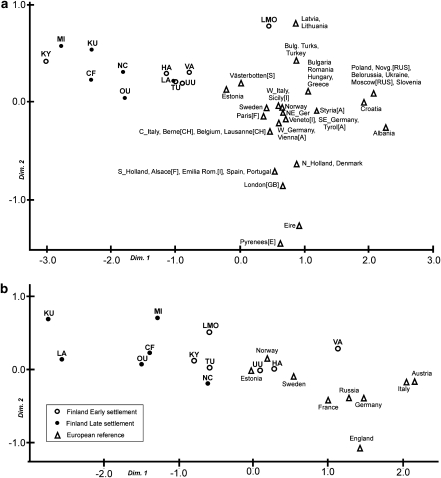
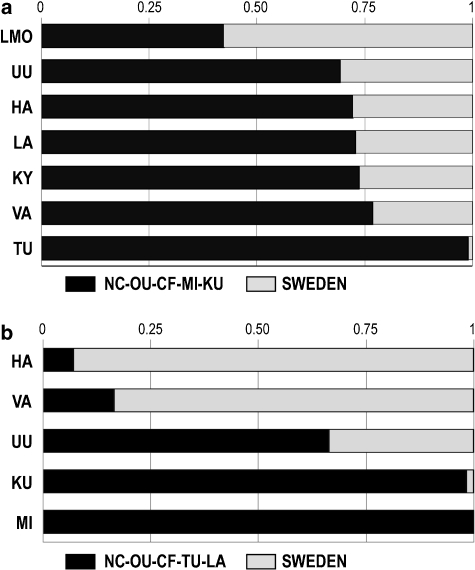
The Finnish population in Northern Europe has been a target of extensive genetic studies during the last decades. The population is considered as a homogeneous isolate, well suited for gene mapping studies because of its reduced diversity and homogeneity. However, several studies have shown substantial differences between the eastern and western parts of the country, especially in the male-mediated Y chromosome. This divergence is evident in non-neutral genetic variation also and it is usually explained to stem from founder effects occurring in the settlement of eastern Finland as late as in the 16th century. Here, we have reassessed this population historical scenario using Y-chromosomal, mitochondrial and autosomal markers and geographical sampling covering entire Finland. The obtained results suggest substantial Scandinavian gene flow into south-western, but not into the eastern, Finland. Male-biased Scandinavian gene flow into the south-western parts of the country would plausibly explain the large inter-regional differences observed in the Y-chromosome, and the relative homogeneity in the mitochondrial and autosomal data. On the basis of these results, we suggest that the expression of 'Finnish Disease Heritage' illnesses, more common in the eastern/north-eastern Finland, stems from long-term drift, rather than from relatively recent founder effects.
Figures
References
-
- Lao O, Lu TT, Nothnagel M, et al. Correlation between genetic and geographic structure in Europe. Curr Biol. 2008;18:1241–1248. - PubMed
-
- Peltonen L, Palotie A, Lange K. Use of population isolates for mapping complex traits. Nat Rev Genet. 2000;1:182–190. - PubMed
-
- Lappalainen T, Koivumäki S, Salmela E, et al. Regional differences among the Finns: a Y-chromosomal perspective. Gene. 2006;376:207–215. - PubMed
-
- Palo JU, Hedman M, Ulmanen I, Lukka M, Sajantila A. High degree of Y-chromosomal divergence within Finland – forensic aspects. Forensic Sci Int Genet. 2007;1:120–124. - PubMed
Publication types
MeSH terms
Substances
LinkOut - more resources
Full Text Sources
