. 2009;4(4):e5264.
doi: 10.1371/journal.pone.0005264. Epub 2009 Apr 15.

MVA.85A boosting of BCG and an attenuated, phoP deficient M. tuberculosis vaccine both show protective efficacy against tuberculosis in rhesus macaques

Affiliations

MVA.85A boosting of BCG and an attenuated, phoP deficient M. tuberculosis vaccine both show protective efficacy against tuberculosis in rhesus macaques

Frank A W Verreck et al. PLoS One. 2009.

Erratum in

  • PLoS One. 2011;6(2). doi:10.1371/annotation/e599dafd-8208-4655-a792-21cb125f7f66

Abstract

Background: Continuous high global tuberculosis (TB) mortality rates and variable vaccine efficacy of Mycobacterium bovis Bacille Calmette-Guérin (BCG) motivate the search for better vaccine regimes. Relevant models are required to downselect the most promising vaccines entering clinical efficacy testing and to identify correlates of protection.

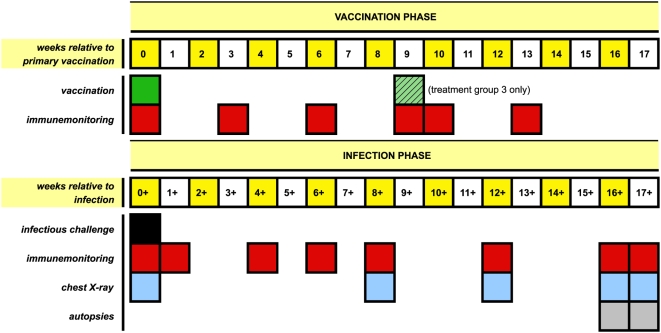
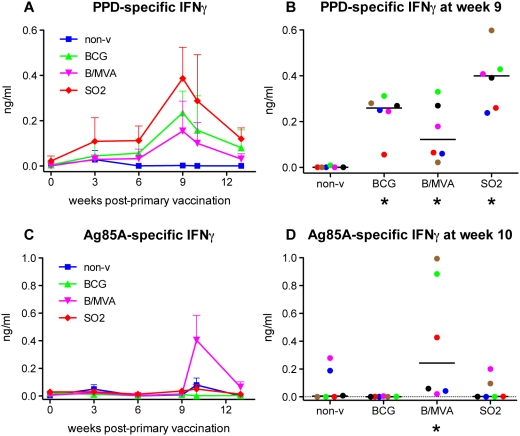
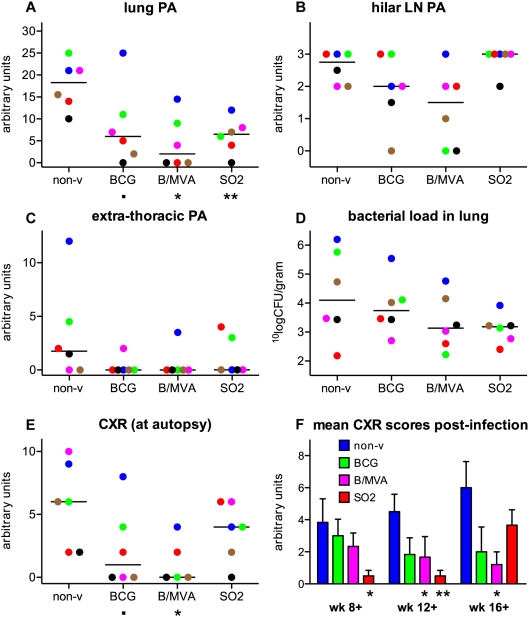
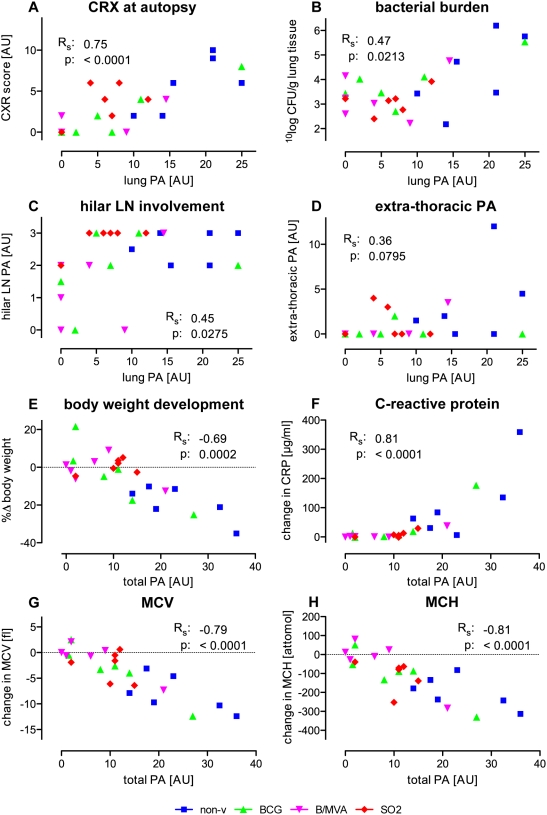
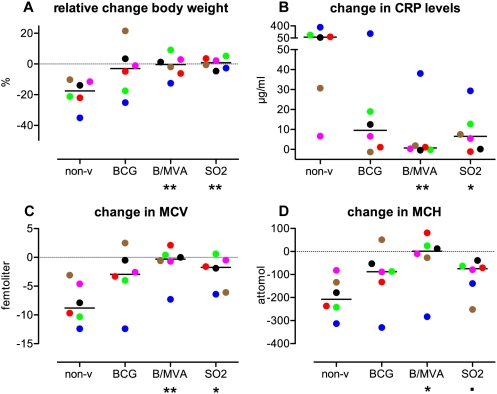
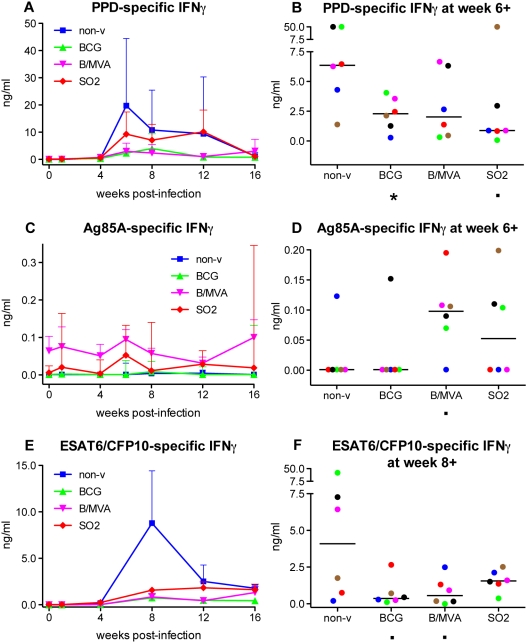
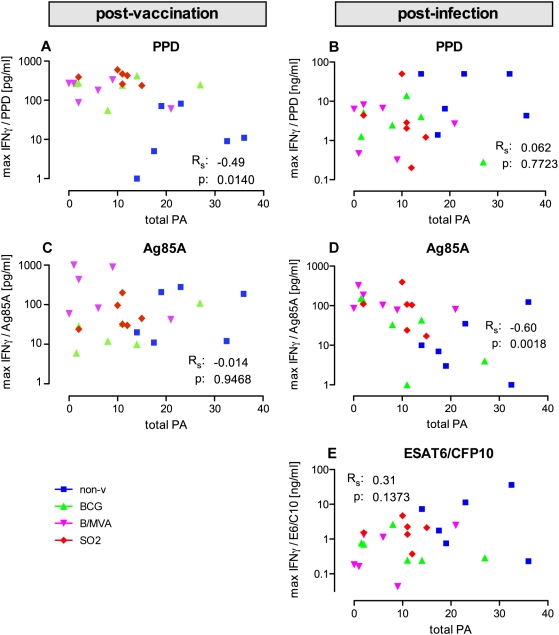
Methods and findings: Here, we evaluated immunogenicity and protection against Mycobacterium tuberculosis in rhesus monkeys with two novel strategies: BCG boosted by modified vaccinia virus Ankara expressing antigen 85A (MVA.85A), and attenuated M. tuberculosis with a disrupted phoP gene (SO2) as a single-dose vaccine. Both strategies were well tolerated, and immunogenic as evidenced by induction of specific IFNgamma responses. Antigen 85A-specific IFNgamma secretion was specifically increased by MVA.85A boosting. Importantly, both MVA.85A and SO2 treatment significantly reduced pathology and chest X-ray scores upon infectious challenge with M. tuberculosis Erdman strain. MVA.85A and SO2 treatment also showed reduced average lung bacterial counts (1.0 and 1.2 log respectively, compared with 0.4 log for BCG) and significant protective effect by reduction in C-reactive protein levels, body weight loss, and decrease of erythrocyte-associated hematologic parameters (MCV, MCH, Hb, Ht) as markers of inflammatory infection, all relative to non-vaccinated controls. Lymphocyte stimulation revealed Ag85A-induced IFNgamma levels post-infection as the strongest immunocorrelate for protection (spearman's rho: -0.60).

Conclusions: Both the BCG/MVA.85A prime-boost regime and the novel live attenuated, phoP deficient TB vaccine candidate SO2 showed significant protective efficacy by various parameters in rhesus macaques. Considering the phylogenetic relationship between macaque and man and the similarity in manifestations of TB disease, these data support further development of these primary and combination TB vaccine candidates.


Conflict of interest statement

Competing Interests: AVSH, SCG and HM are all co-inventors on a composition of matter patent for MVA85A and are shareholders in a Joint Venture established to develop this vaccine.

Figures

Figure 1
Figure 1. Experimental plan.
A schematic diagram illustrating the timelines of vaccination (priming at week 0, boosting at week 9 for group 3 only), infectious challenge, immune monitoring, chest X-ray recording and fixed endpoint/autopsies by study protocol all relative to the 18 weeks immunisation phase or the 17/18 weeks challenge phase.
Figure 2
Figure 2. Mycobacterium-specific IFNγ secretion post-vaccination.
Both the SO2 primary and the MVA.85A booster vaccine are immunogenic in rhesus macaques. Antigen-specific IFNγ secretion was measured after 3 days of in vitro stimulation of fresh peripheral blood lymphocytes along the vaccination phase. PPD-specific IFNγ secretion is depicted as group mean responses (+standard error) in time (A), and as individual responses with medians at the peak of the mean group response (B). Similarly, results upon stimulation with recombinant Ag85A are displayed as group means (+standard error) in time (C), and as individual responses (with medians) at peak (D), respectively. Colouring of group medians (panels A and C) is representing non-vaccinated controls in blue, BCG only in green, BCG/MVA.85A in magenta, and SO2 vaccination in red; group colouring is maintained throughout the paper for comparibility of data. Dot plots representing individual animals (panels B and D) are consistently coloured as follows: animals per treatment group were ranked from highest to lowest total gross pathology score (sum of lung, hilar LN and extra-thoracic scores) and then assigned the colours: blue, green, magenta, red, brown, black, respectively; individual colouring is maintained throughout for comparability. P-values are relative to non-vaccinated control treatment and represented under the x-axis by symbols as follows: ▪ for 0.1>p≥0.05, ★ for 0.05>p≥0.01, ★★ for 0.01>p≥0.001.
Figure 3
Figure 3. Evaluation of gross pathology, radiology and bacterial loads upon infectious challenge.
Individual scores per treatment group and group median values are plotted for macroscopic lung pathology (PA) (A), hilar LN involvement (B), extra-thoracic PA (C), bacterial burden in the lung (D), and chest X-ray (CXR) scores at autopsy (E). Kinetics of TB disease are reflected by mean CXR scores (+standard error of the mean) per treatment group in time (F). BCG/MVA shows protection by significantly reduced lung lesion scores and CXR scores at autopsy compared to non-vaccinated controls, and by reduced hilar LN involvement and CFU in the lung (not significant). SO2 in comparison to non-vaccinated controls shows significant protection by reduced lung lesion scores and delayed kinetics of TB by CXR in time, and by reduced CFU in the lung (not significant). For legends of colouring and symbols see legend to Figure 2. For BCG/MVA treatment CXR at autopsy n = 5; one recording censored due to technical error.
Figure 4
Figure 4. Correlations of disease along the infection phase.
Thorax radiology, bacterial burden, and hilar LN pathology correlate significantly with lung PA. Loss of total body weight (wasting), and C-reactive protein (CRP) levels and decreasing mean corpuscular volume (MCV) and mean corpuscular hemoglobin (MCH) as measures of systemic inflammation, are highly significant correlates of disease in this high dose challenge model for TB vaccine evaluation. Parameters are plotted per individual (with colouring as indicated in the legend to Figure 2 on group colouring) against lung PA for CXR scores at autopsy (A), CFU counts from lung homogenates (B), hilar LN involvement (C), disseminated extra-thoracic lesions (D), and against total pathology (the sum of lung, hilar LN and extra-thoracic PA scores) for relative change in body weight (E), change in CRP (F), change in MCV (G) and in MCH (H). Spearman's rho (Rs) as correlation factor and p-value are indicated. (AU for arbitrary units.)
Figure 5
Figure 5. Evaluation of clinical measures along the infection phase.
The BCG/MVA.85A regime and SO2 vaccination in comparison to non-vaccinated controls show significant protection from TB-associated wasting disease and systemic inflammation. Individual scores and group medians are plotted for relative change in body weight from start to end of the infection phase (A), change in C-reactive protein (CRP) levels (B), in mean corpuscular volume (MCV) (C), and in mean corpuscular hemoglobin (MCH) (D). For legends of colouring and symbols see legend to Figure 2.
Figure 6
Figure 6. Mycobacterium-specific IFNγ secretion post-infection.
Both PPD and ESAT6-CFP10 fusion protein, but not Ag85A, induce relatively high levels of IFNγ from in vitro stimulated fresh PBMC after infectious challenge with M. tuberculosis. Treatment group means (+standard errors) are plotted in time for PPD (A), Ag85A (C) and ESAT6/CFP10 fusion protein (E), and as individual responses (with group medians) at the peak of the mean response as indicated (B, D and F, respectively). For legends of colouring and symbols see legend to Figure 2.
Figure 7
Figure 7. Immune correlations of disease.
Maximal PPD-specific IFNγ levels post-vaccination and maximal Ag85A-specific IFNγ post-infection show significant inverse correlations with TB disease by total gross lesion PA scores. Maximal antigen-specific IFNγ response levels are plotted per individual against total pathology scores (with colouring as indicated in the legend to figure 2 on group colouring) and post-vaccination and post-infection for PPD (A and B, respectively) and Ag85A (C and D, respectively), and for ESAT6-CFP10 fusion protein post-infection only (E).

References

    1. Global tuberculosis control: surveillance, planning, financing: WHO report 2008. WHO/HTM/TB/2008.393, at http://www.who.int/tb/publications/2008/en/index.html.
    1. Fine PE. Variation in protection by BCG: implications of and for heterologous immunity. Lancet. 1995;346:1339–1345. - PubMed
    1. Skeiky YAW, Sadoff JC. Advances in tuberculosis vaccine strategies. Nat Rev Microbiol. 2006;4:469–476. - PubMed
    1. Baumann S, Nasser Eddine A, Kaufmann SH. Progress in tuberculosis vaccine development. Curr Opin Immunol. 2006;18:438–448. - PubMed
    1. Hussey G, Hawkridge T, Hanekom W. Childhood tuberculosis: old and new vaccines. Paediatr Respir Rev. 2007;8:148–154. - PubMed

Publication types

MeSH terms