

Expression patterns of the aquaporin gene family during renal development: influence of genetic variability
- PMID: 19367412
- PMCID: PMC2756349
- DOI: 10.1007/s00424-009-0667-x
Expression patterns of the aquaporin gene family during renal development: influence of genetic variability
Abstract
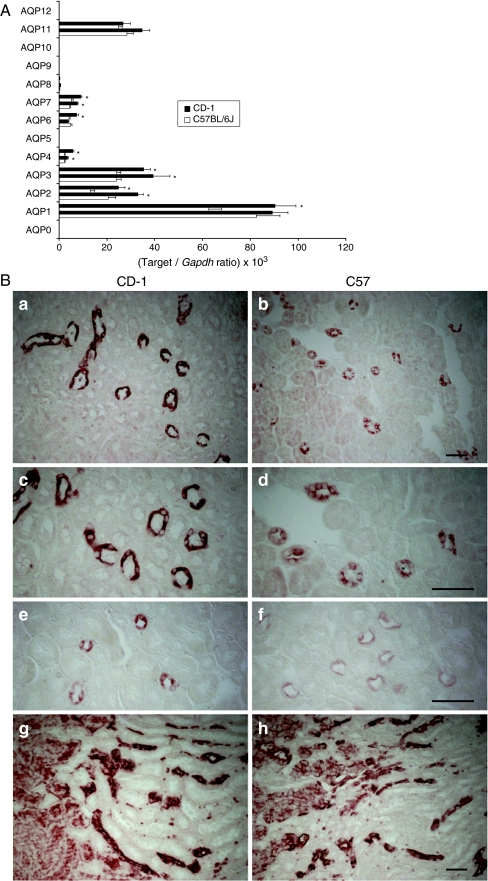
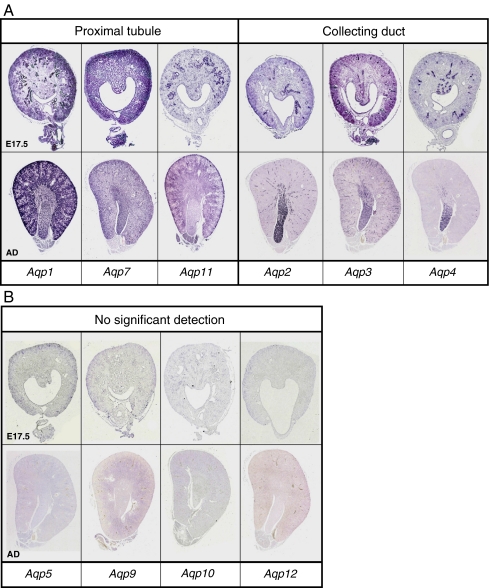
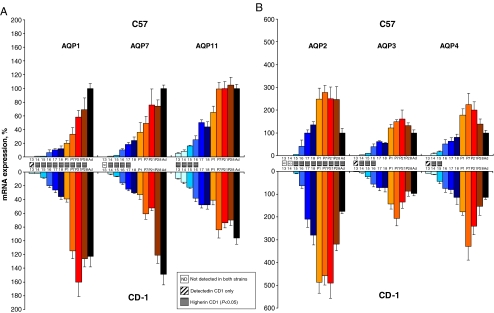
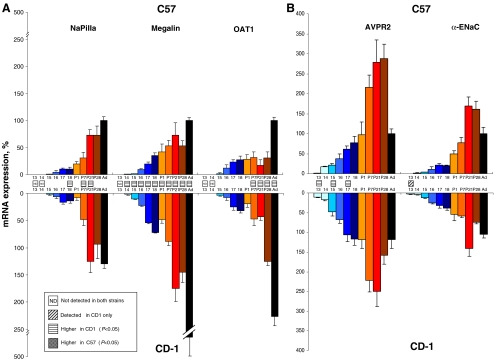
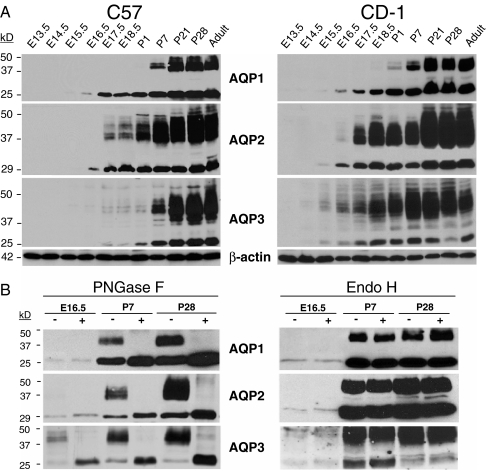
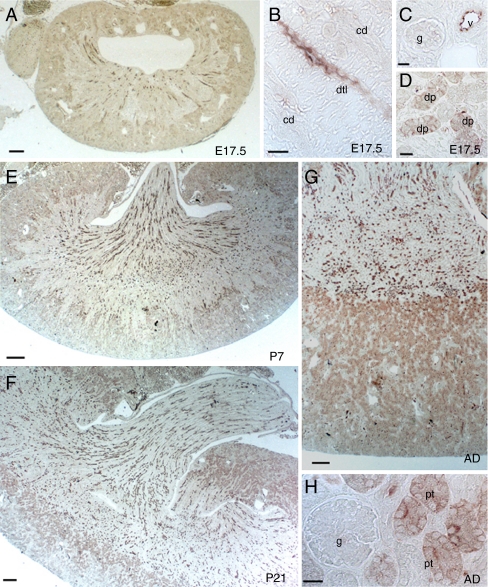
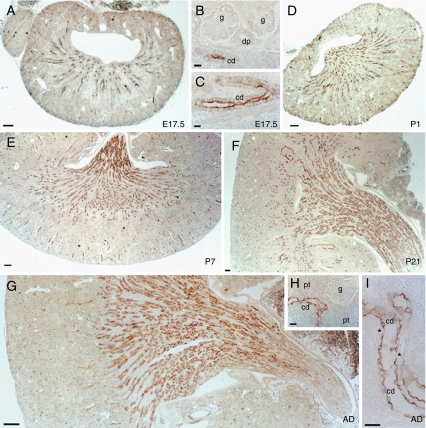
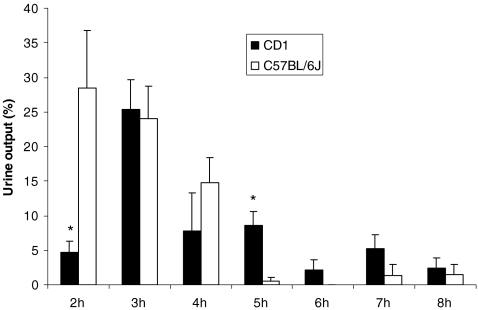
High-throughput analyses have shown that aquaporins (AQPs) belong to a cluster of genes that are differentially expressed during kidney organogenesis. However, the spatiotemporal expression patterns of the AQP gene family during tubular maturation and the potential influence of genetic variation on these patterns and on water handling remain unknown. We investigated the expression patterns of all AQP isoforms in fetal (E13.5 to E18.5), postnatal (P1 to P28), and adult (9 weeks) kidneys of inbred (C57BL/6J) and outbred (CD-1) mice. Using quantitative polymerase chain reaction (PCR), we evidenced two mRNA patterns during tubular maturation in C57 mice. The AQPs 1-7-11 showed an early (from E14.5) and progressive increase to adult levels, similar to the mRNA pattern observed for proximal tubule markers (Megalin, NaPi-IIa, OAT1) and reflecting the continuous increase in renal cortical structures during development. By contrast, AQPs 2-3-4 showed a later (E15.5) and more abrupt increase, with transient postnatal overexpression. Most AQP genes were expressed earlier and/or stronger in maturing CD-1 kidneys. Furthermore, adult CD-1 kidneys expressed more AQP2 in the collecting ducts, which was reflected by a significant delay in excreting a water load. The expression patterns of proximal vs. distal AQPs and the earlier expression in the CD-1 strain were confirmed by immunoblotting and immunostaining. These data (1) substantiate the clustering of important genes during tubular maturation and (2) demonstrate that genetic variability influences the regulation of the AQP gene family during tubular maturation and water handling by the mature kidney.
Figures
Similar articles
-
Ontogeny of the mammalian kidney: expression of aquaporins 1, 2, 3, and 4.World J Pediatr. 2014 Nov;10(4):306-12. doi: 10.1007/s12519-014-0508-7. Epub 2014 Dec 17. World J Pediatr. 2014. PMID: 25515803 Review.
-
Immunoexpression of aquaporins 1, 2, 3 and 4 in kidney of yak (Bos grunniens) on the Qinghai-Tibetan Plateau.Biotech Histochem. 2019 Jan;94(1):48-52. doi: 10.1080/10520295.2018.1495843. Epub 2018 Oct 17. Biotech Histochem. 2019. PMID: 30328721
-
The perinatal expression of aquaporin-2 and aquaporin-3 in developing kidney.Pediatr Res. 1998 Jun;43(6):783-90. doi: 10.1203/00006450-199806000-00011. Pediatr Res. 1998. PMID: 9621988
-
Postnatal expression of aquaporins in epithelial cells of the rat epididymis.Biol Reprod. 2006 Feb;74(2):427-38. doi: 10.1095/biolreprod.105.044735. Epub 2005 Oct 12. Biol Reprod. 2006. PMID: 16221990
-
Aquaporins in avian kidneys: function and perspectives.Am J Physiol Regul Integr Comp Physiol. 2013 Dec;305(11):R1201-14. doi: 10.1152/ajpregu.00177.2013. Epub 2013 Sep 25. Am J Physiol Regul Integr Comp Physiol. 2013. PMID: 24068044 Review.
Cited by
-
Ex vivo live cell tracking in kidney organoids using light sheet fluorescence microscopy.PLoS One. 2018 Jul 26;13(7):e0199918. doi: 10.1371/journal.pone.0199918. eCollection 2018. PLoS One. 2018. PMID: 30048451 Free PMC article.
-
Construction of arginine vasopressin receptor 2-deficient rats by the rGONAD method.Clin Exp Nephrol. 2025 Jul;29(7):888-898. doi: 10.1007/s10157-025-02652-5. Epub 2025 Mar 18. Clin Exp Nephrol. 2025. PMID: 40102322
-
Ontogeny of the mammalian kidney: expression of aquaporins 1, 2, 3, and 4.World J Pediatr. 2014 Nov;10(4):306-12. doi: 10.1007/s12519-014-0508-7. Epub 2014 Dec 17. World J Pediatr. 2014. PMID: 25515803 Review.
-
The GUDMAP database--an online resource for genitourinary research.Development. 2011 Jul;138(13):2845-53. doi: 10.1242/dev.063594. Development. 2011. PMID: 21652655 Free PMC article.
-
Influence of sex on aquaporin1-4 and vasopressin V2 receptor expression in the pig kidney during development.Pediatr Res. 2016 Sep;80(3):452-9. doi: 10.1038/pr.2016.94. Epub 2016 Apr 18. Pediatr Res. 2016. PMID: 27089501
References
-
- {'text': '', 'ref_index': 1, 'ids': [{'type': 'DOI', 'value': '10.1002/anie.200460804', 'is_inner': False, 'url': 'https://doi.org/10.1002/anie.200460804'}, {'type': 'PubMed', 'value': '15368374', 'is_inner': True, 'url': 'https://pubmed.ncbi.nlm.nih.gov/15368374/'}]}
- Agre P (2004) Aquaporin water channels (Nobel Lecture). Angew Chem Int Ed Engl 43:4278–4290 - PubMed
-
- {'text': '', 'ref_index': 1, 'ids': [{'type': 'DOI', 'value': '10.1681/ASN.2006010052', 'is_inner': False, 'url': 'https://doi.org/10.1681/asn.2006010052'}, {'type': 'PubMed', 'value': '17475819', 'is_inner': True, 'url': 'https://pubmed.ncbi.nlm.nih.gov/17475819/'}]}
- Ahrabi AK, Terryn S, Valenti G et al (2007) PKD1 haploinsufficiency causes a syndrome of inappropriate antidiuresis in mouse. J Am Soc Nephrol 18:1740–1753 - PubMed
-
- {'text': '', 'ref_index': 1, 'ids': [{'type': 'DOI', 'value': '10.1158/0008-5472.CAN-04-0496', 'is_inner': False, 'url': 'https://doi.org/10.1158/0008-5472.can-04-0496'}, {'type': 'PubMed', 'value': '15289330', 'is_inner': True, 'url': 'https://pubmed.ncbi.nlm.nih.gov/15289330/'}]}
- Andersen CL, Jensen JL, Orntoft TF (2004) Normalization of real-time quantitative reverse transcription-PCR data: a model-based variance estimation approach to identify genes suited for normalization, applied to bladder and colon cancer data sets. Cancer Res 64:5245–5250 - PubMed
-
- {'text': '', 'ref_index': 1, 'ids': [{'type': 'DOI', 'value': '10.1203/00006450-199806000-00011', 'is_inner': False, 'url': 'https://doi.org/10.1203/00006450-199806000-00011'}, {'type': 'PubMed', 'value': '9621988', 'is_inner': True, 'url': 'https://pubmed.ncbi.nlm.nih.gov/9621988/'}]}
- Baum MA, Ruddy MK, Hosselet CA, Harris HW (1998) The perinatal expression of aquaporin-2 and aquaporin-3 in developing kidney. Pediatr Res 43:783–790 - PubMed
-
- {'text': '', 'ref_index': 1, 'ids': [{'type': 'DOI', 'value': '10.1016/S0959-4388(02)00356-2', 'is_inner': False, 'url': 'https://doi.org/10.1016/s0959-4388(02)00356-2'}, {'type': 'PubMed', 'value': '12367636', 'is_inner': True, 'url': 'https://pubmed.ncbi.nlm.nih.gov/12367636/'}]}
- Carson JP, Thaller C, Eichele G (2002) A transcriptome atlas of the mouse brain at cellular resolution. Curr Opin Neurobiol 2002(12):562–565 - PubMed
Publication types
MeSH terms
Substances
LinkOut - more resources
Full Text Sources
Molecular Biology Databases
