

Comparative Study
doi: 10.1080/07357900802653464.
Expression and activity of carbonic anhydrase IX is associated with metabolic dysfunction in MDA-MB-231 breast cancer cells
Affiliations
- PMID: 19367501
- PMCID: PMC2873695
- DOI: 10.1080/07357900802653464
Item in Clipboard
Comparative Study
Expression and activity of carbonic anhydrase IX is associated with metabolic dysfunction in MDA-MB-231 breast cancer cells
Cancer Invest.
2009 Jul.
Abstract
The expression of carbonic anhydrase IX (CAIX), a marker for hypoxic tumors, is correlated with poor prognosis in breast cancer patients. We show herein that the MDA-MB-231 cells, a "triple-negative," basal B line, express exclusively CAIX, while a luminal cell line (T47D) expresses carbonic anhydrase XII (CAXII). CAIX expression in the basal B cells is both density- and hypoxia-dependent and is correlated with carbonic anhydrase activity. Evidence is provided that CAIX contributes to extracellular acidification through studies on pH, lactic acid production, and CAIX inhibition. Together, these studies suggest that CAIX expression and activity is associated with metabolic dysfunction in MDA-MB-231 cells.
Figures
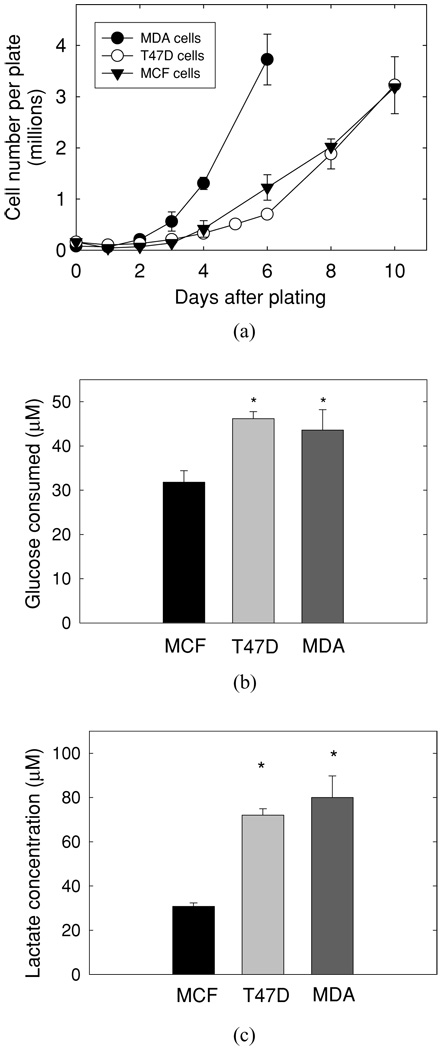
Characterization of human breast cancer lines. (a) MDA-MB-231 (MDA), T47D, and MCF10A (MCF) cells were plated and grown as described in Material and Methods. At specific times after plating, cell number was determined using a Coulter Counter ZM. Each set of data represent at least three independent experiments. The data are reported as the mean ± SD. MDA = MDA-MB-231 cells; T47D = T47D cells; MCF = MCF10A cells, (b) Confluent cells [MCF cells (day 7), T47D cells (day 7), and MDA cells (day 4)] were washed and given fresh medium containing 15-mM glucose. After 4 hr, medium was collected for determining glucose concentration. Data represent the mean ± SD of a single experiment in which n = 6, p < .001 versus MCF cell line, (c) Medium from confluent MCF, T47D, and MDA cells, treated as in (b), was collected and assayed for lactate concentration. Data represent the mean ± SD of a single experiment in which n = 6, p < .003 versus MCF cells. *n = 6.
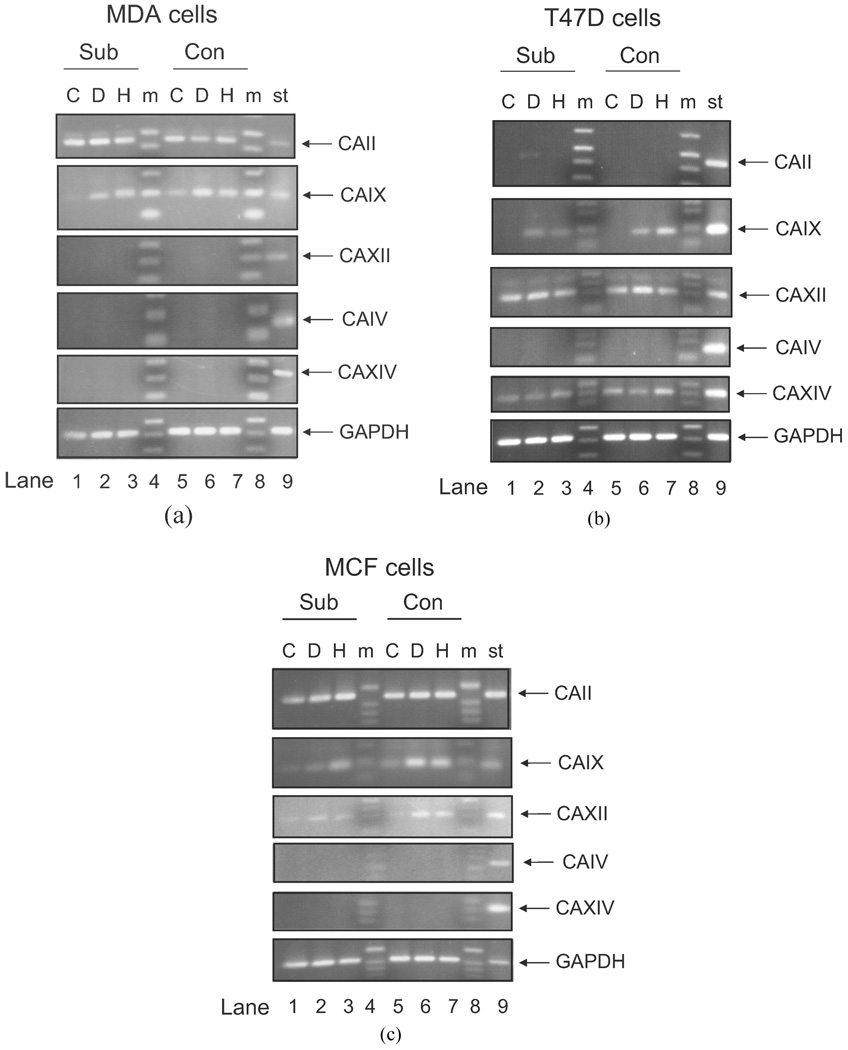
Comparison of CA mRNA expression in human breast cancer lines. RNA was isolated from subconfluent and confluent MDA-MB-231, T47D, and MCF10A cells exposed or not to DFO (100 µM) or to hypoxic conditions (1% oxygen) for 16 hr. RT-PCR was performed as described. C = control; D = DFO; H = hypoxia; m = markers; St = RT-PCR of RNA isolated from select human tissue. The standard RNA for CAIV came from heart; the standard for CAIX came from stomach; the standard for CAXII came from kidney; the standard for CAXIV, CAII, and GAPDH came from liver. GAPDH is used as a control for the RT-PCR reaction. These data represent at least two independent sets of cells.
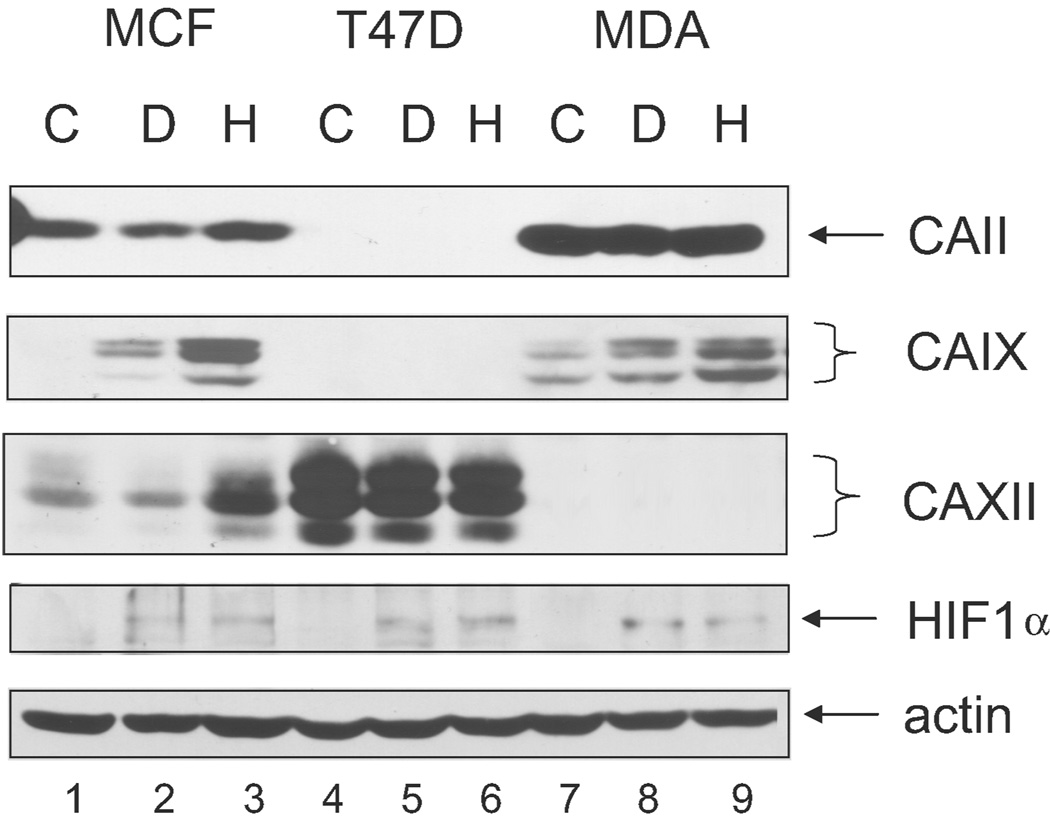
Expression of CA protein in human breast cancer lines. Confluent cells were exposed to DFO or hypoxia as in Figure 2 and then lysed. Equal protein (100 µg) was analyzed by western blot analysis using the M75 monoclonal antibody. Identical results were obtained in independent duplicate experiments. MCF = MCF10A cells; T47D = T47 D cells; MDA = MDA-MB-231 cells; C = control; D = DFO; H = hypoxia.
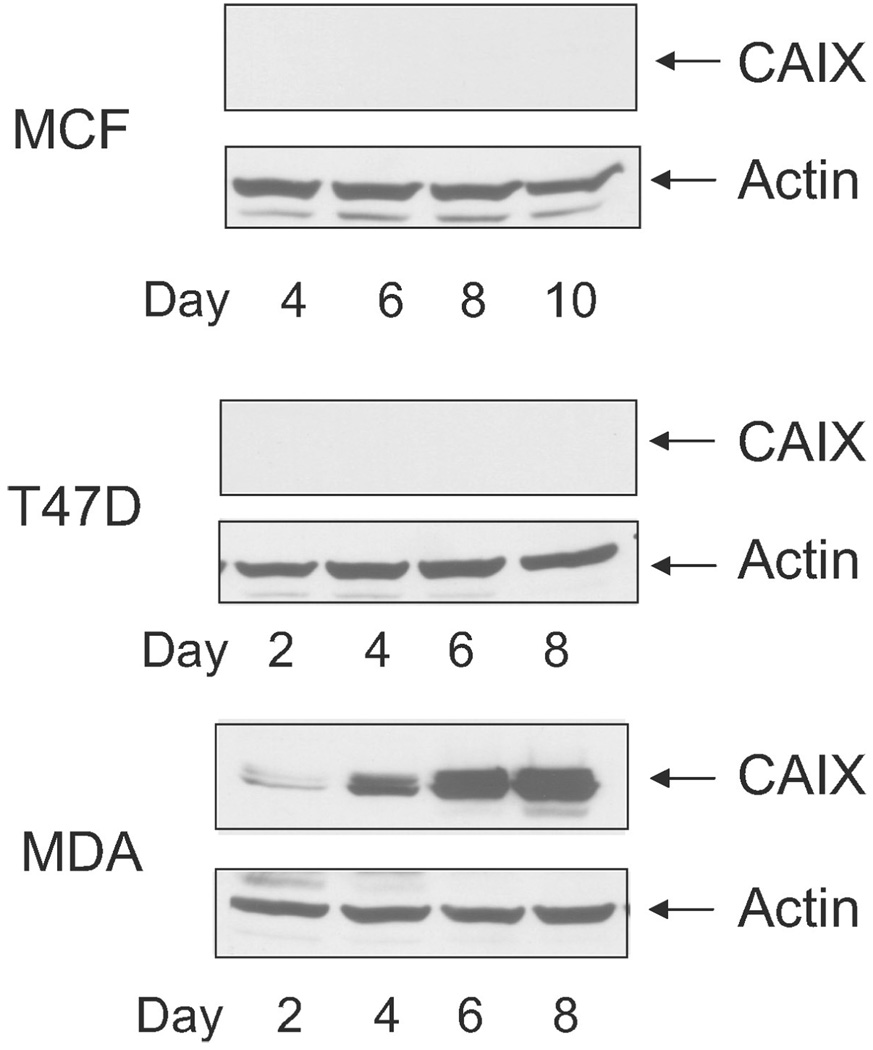
Density-dependent expression of CAIX in breast cancer cells. Cells were collected at specific times after plating. Cells were lysed, and equal protein was analyzed by western blot analysis using the M75 monoclonal antibody. Identical results were obtained in independent duplicate experiments. MCF = MCF10A cells; T47D = T47 D cells; MDA = MDA-MB-231 cells.
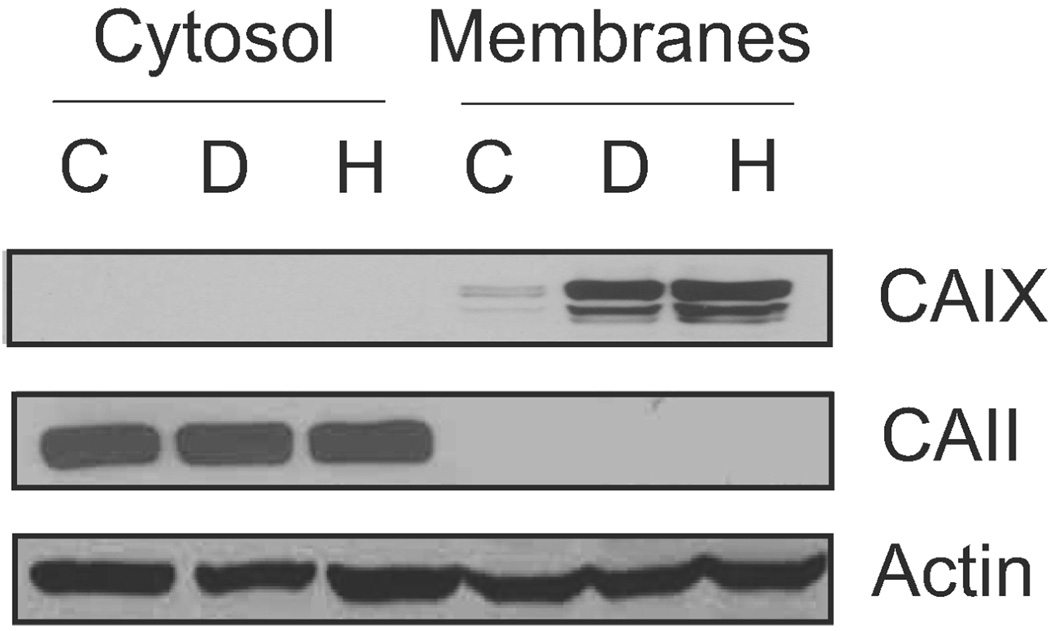
Expression and localization of CAIX. Confluent MDA cells were collected and separated into total membrane and cytoplasmic fractions after exposure or not to DFO or hypoxia. Equal protein was analyzed by western blot analysis for CAIX (using the M75 monoclonal antibody), CAII, and actin expression. C = control; D = DFO; H = hypoxia. These data represent two independent experiments.
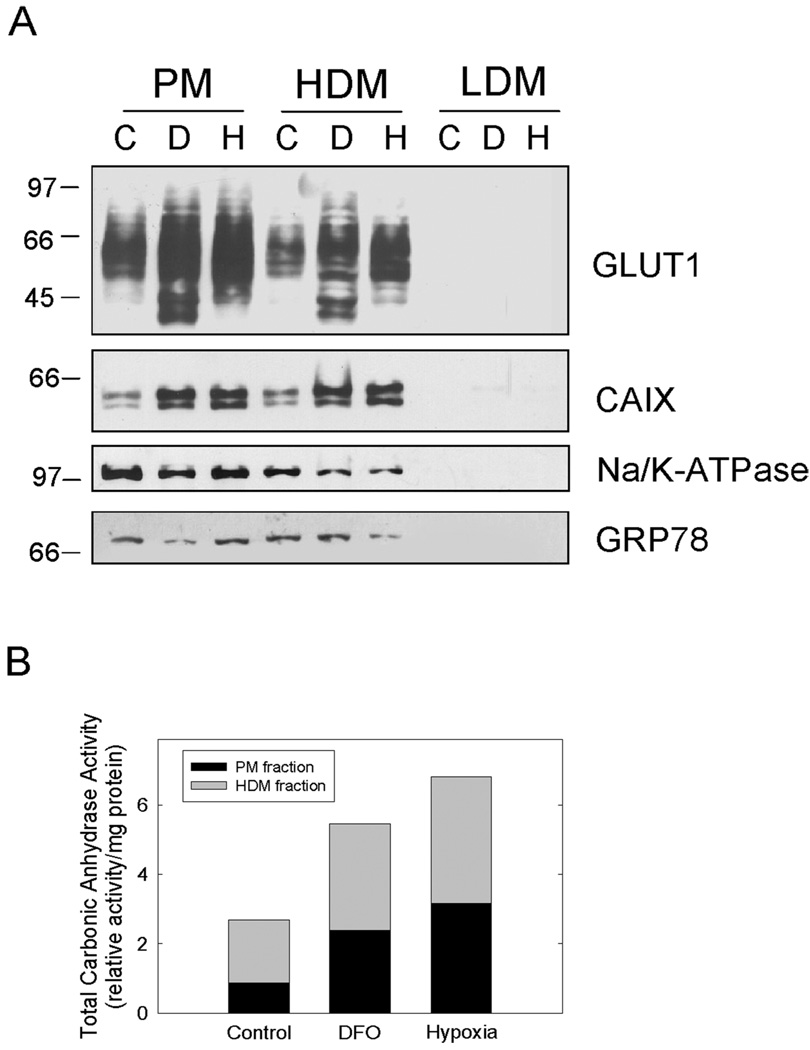
Subcellular localization and activity of CAIX. (a) Confluent MDA-MB-231 cells were collected after treatment with either DFO or hypoxia. Subcellular fractions were collected as described in the methods. Equal protein was separated by SDS-PAGE, transferred to nitrocellulose, and probed for GLUT1, CAIX, Na/K-ATPase, and GRP78. In these experiments, the CAIX antibody used in western blotting was purchased from Novus Biologicals. These data represent two independent experiments. PM = plasma membranes; HDM = high density membranes; LDM = low density membranes. (b) Plasma membrane (PM) and high-density membrane (HDM) fractions isolated as in (a) were assayed for CA activity using 18O exchange. The data are reported as the relative total activity under each condition. The black bars represent PM, and the gray bars represent HDM.
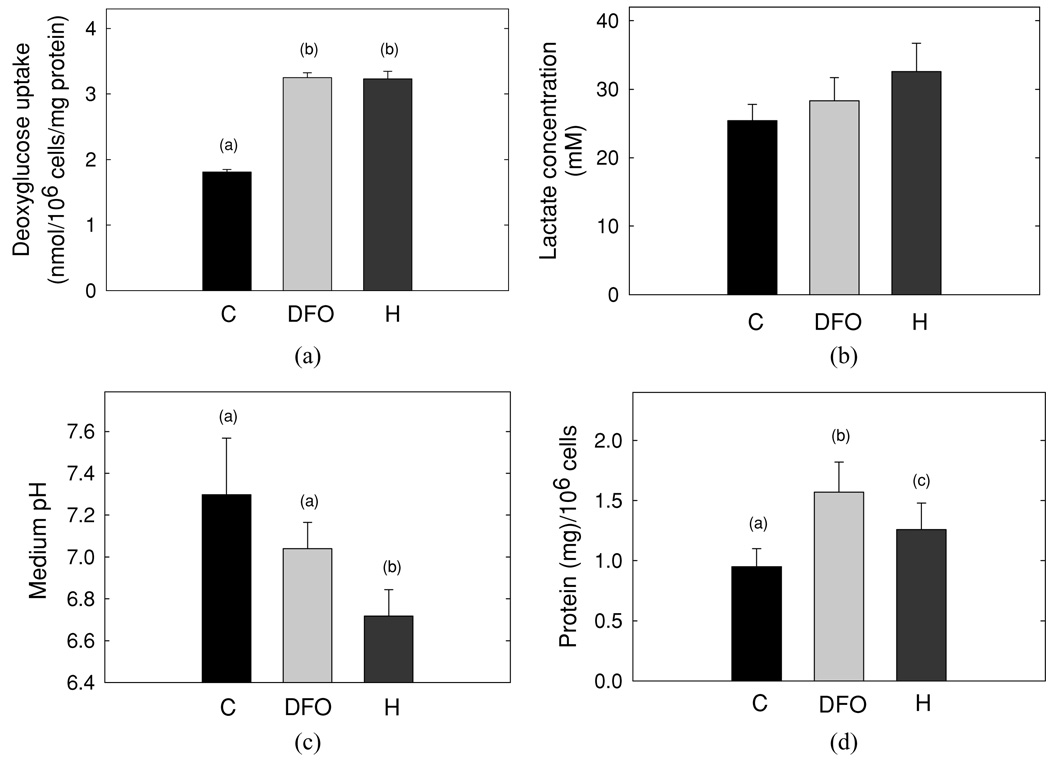
Effect of hypoxia on metabolic activity in MDA cells. (a) MDA-MB-231 cells, at day 3 post plating, were exposed to DFO or hypoxia, washed, and assayed for glucose transport activity. Each data point in a given experiment was performed in duplicate. The duplicates were then averaged and compiled with the means of replicate experiments (n = 3). The data are reported as the mean ± SD. (b) Lactate concentration was determined in medium that was collected from MDA cells treated as in (a). Data are reported as the mean ± SD from three independent experiments. (c) The levels of pH measured in medium that was collected from MDA cells treated as in (a) are shown. Data are reported as the mean ± SD from four independent experiments, (d) Protein content and cell number were determined in MDA cells treated as in (a). Data are reported as the mean protein concentration per 106 cells ± SD from four independent experiments.
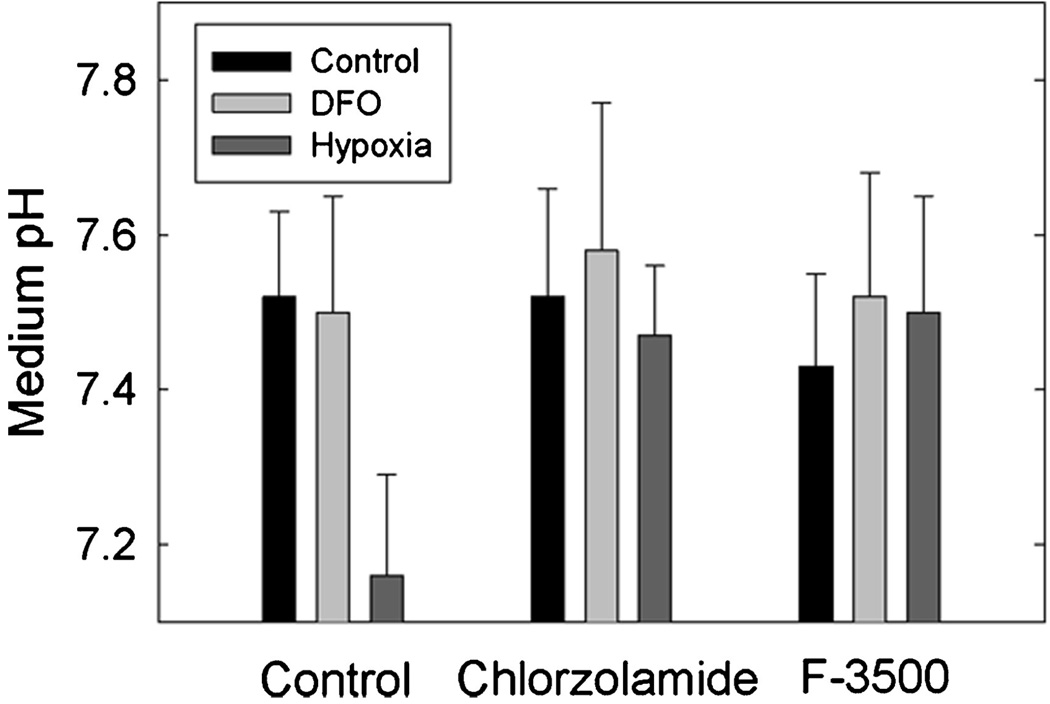
Effect of CA Inhibitors on medium pH. Cells were treated 2 days post plating with DFO, or exposed to 1% oxygen, for 16 hr in the absence or presence of 100-µM chlorozolamide or F3500. The pH of the medium was tested at the end of the incubation, which will be noted is higher, overall, than that in Figure 7 because of the lower density of the cells. Data are reported as the mean ± SD, n = 3.
References
-
- Dang CV, Semenza GL. Oncogenic alterations of metabolism. Trends Biochem. Sci. 1999;24:68–69. - PubMed
-
- Cairns R, Papandreou I, Denko N. Overcoming physiologic barriers to cancer treatment by molecularly targeting the tumor microenvironment. Mol Cancer Res. 2006;4:61–70. - PubMed
-
- Warburg O. On the origin of cancer cells. Science. 1956;123:309–314. - PubMed
-
- Younes M, Brown RW, Mody DR, Fernandez L, Laucirica R. GLUT1 expression in human breast carcinoma: correlation with known prognostic markers. Anticancer Res. 1995;15:2895–2898. - PubMed
-
- Younes M, Lechago LV, Somoano JR, Mosharaf M, Lechago J. Wide expression of the human erythrocyte glucose transporter GLUT1 in human cancers. Cancer Res. 1996;56:1164–1167. - PubMed
Publication types
MeSH terms
Substances
Grants and funding
LinkOut - more resources
Full Text Sources
Other Literature Sources
Medical
Miscellaneous