. 2008 Dec 11;112(49):15844-55.
doi: 10.1021/jp808139e.

Photoexcitation of adenine cation radical [A*+] in the near UV-vis region produces sugar radicals in adenosine and in its nucleotides

Affiliations

Photoexcitation of adenine cation radical [A*+] in the near UV-vis region produces sugar radicals in adenosine and in its nucleotides

Amitava Adhikary et al. J Phys Chem B. .

Abstract

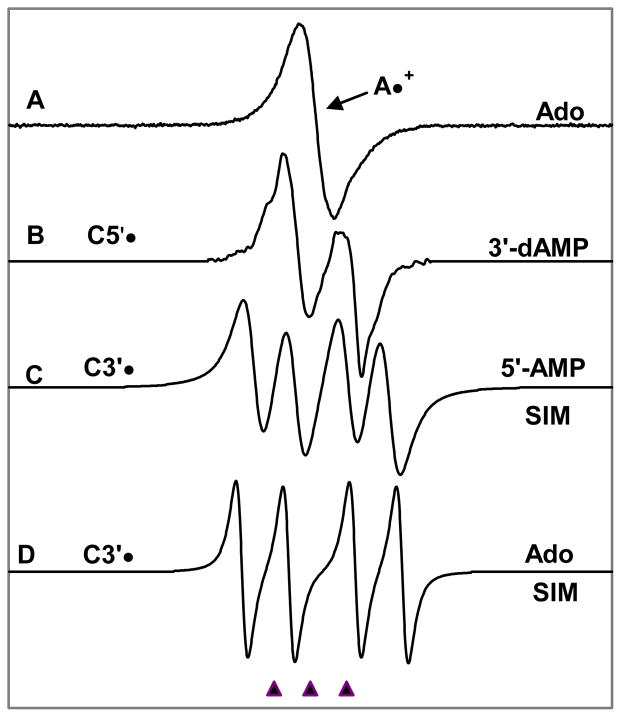
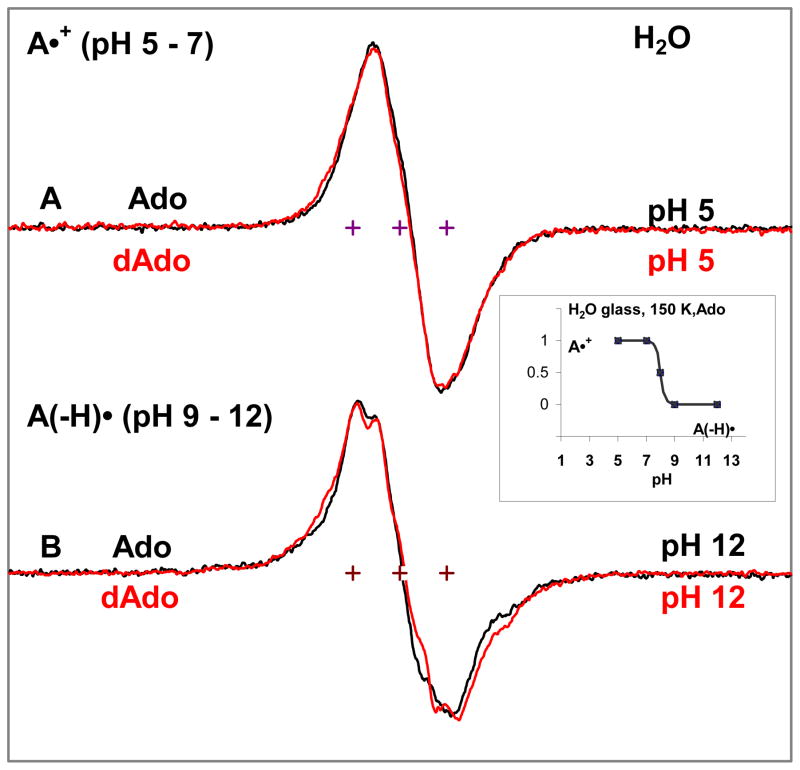
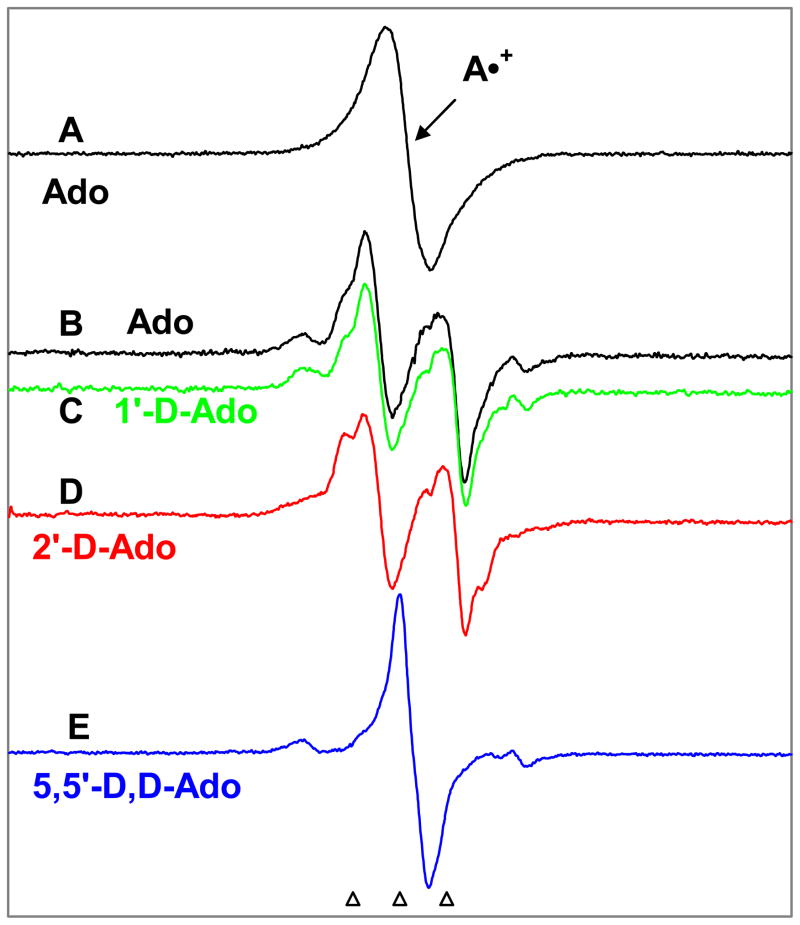
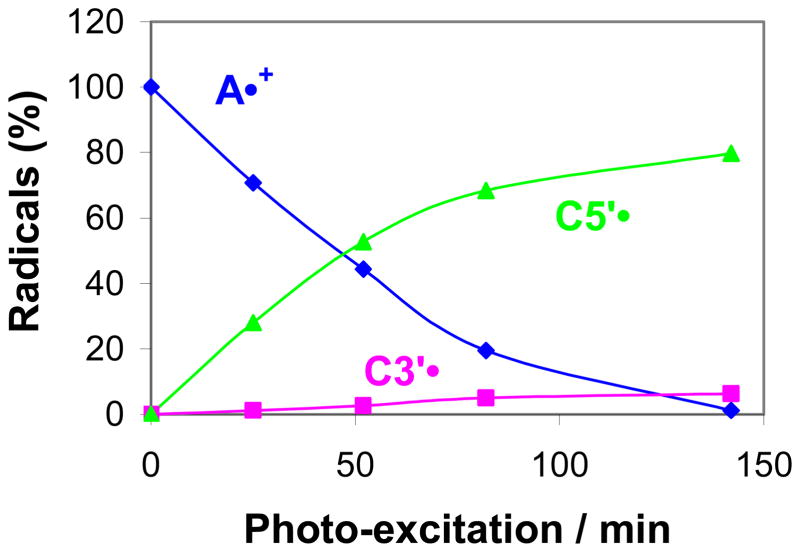
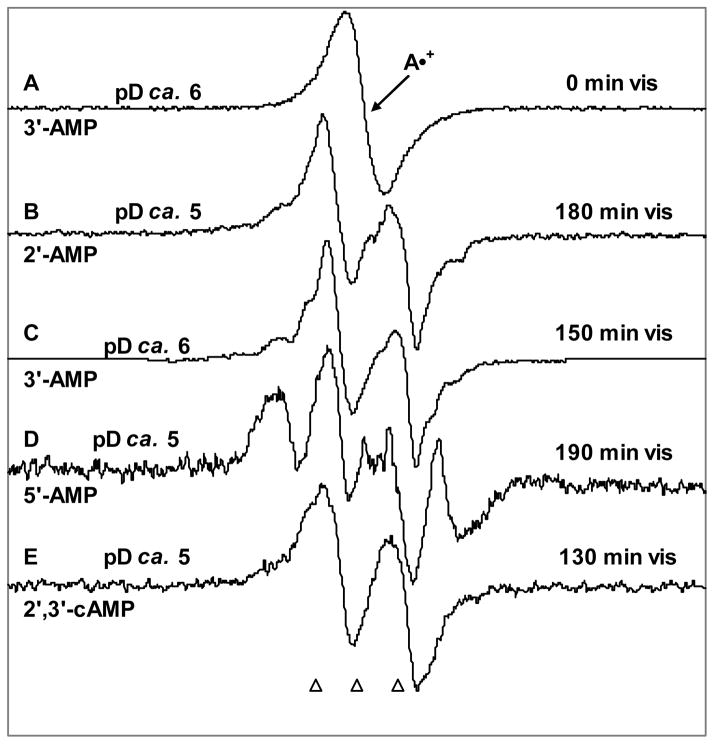
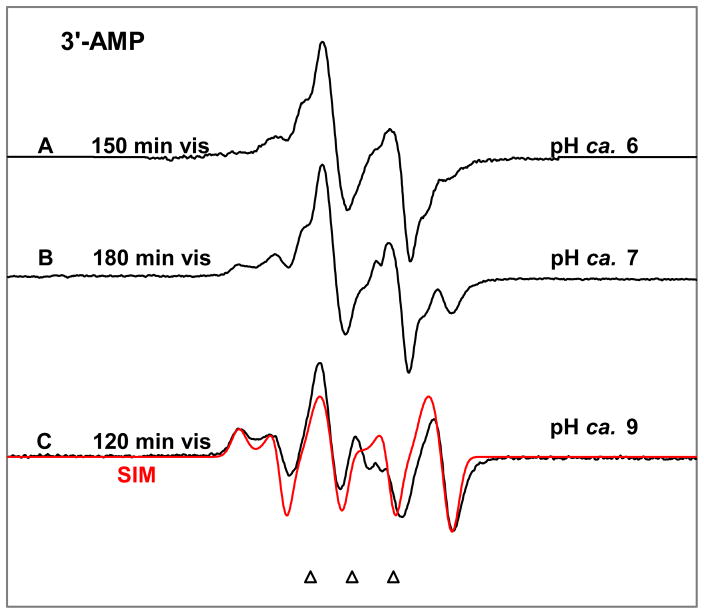
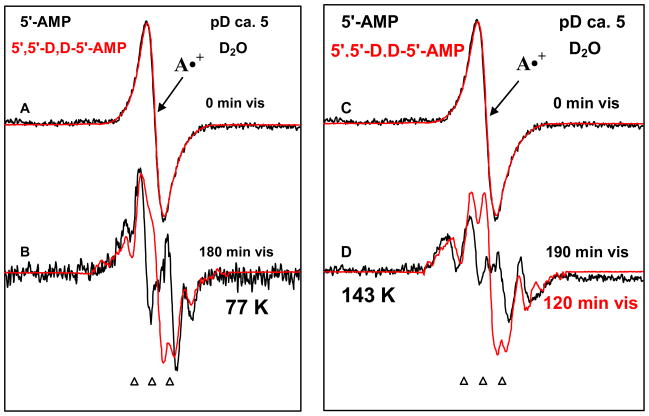
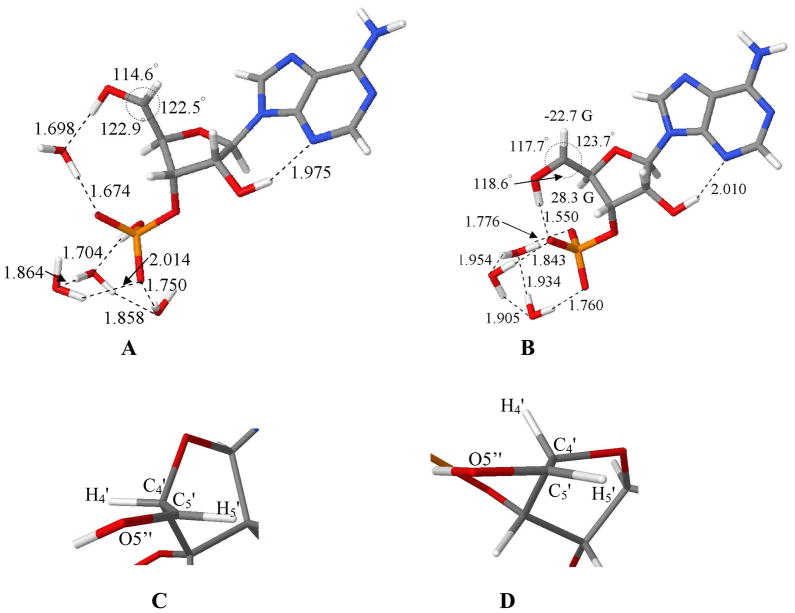
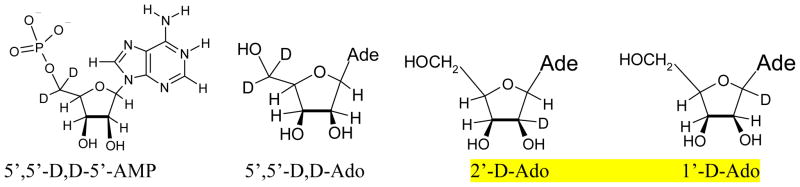
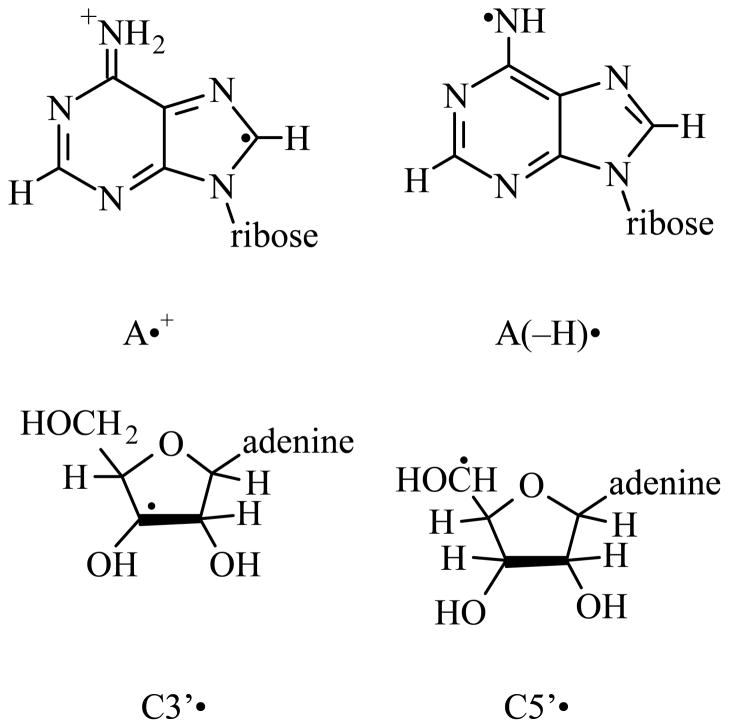
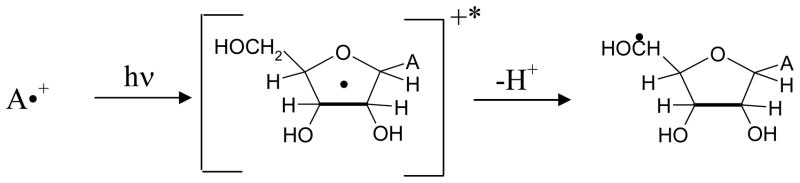
In this study, we report the formation of ribose sugar radicals in high yields (85-100%) via photoexcitation of adenine cation radical (A*+) in Ado and its ribonucleotides. Photoexcitation of A*+ at low temperatures in homogeneous aqueous glassy samples of Ado, 2'-AMP, 3'-AMP, and 5'-AMP forms sugar radicals predominantly at C5'- and also at C3'-sites. The C5'* and C3'* sugar radicals were identified employing Ado deuterated at specific carbon sites: C1', C2', and C5'. Phosphate substitution is found to deactivate sugar radical formation at the site of substitution. Thus, in 5'-AMP, C3'* is observed to be the main radical formed via photoexcitation at ca. 143 K, whereas, in 3'-AMP, C5'* is the only species found. These results were supported by results obtained employing 5'-AMP with specific deuteration at the C5'-site (i.e., 5',5'-D,D-5'-AMP). Moreover, contrary to the C5'* observed in 3'-dAMP, we find that C5'* in 3'-AMP shows a clear pH-dependent conformational change as evidenced by a large increase in the C4' beta-hyperfine coupling on increasing the pH from 6 to 9. Calculations performed employing DFT (B3LYP/6-31G*) for C5'* in 3'-AMP show that the two conformations of C5'* result from strong hydrogen bond formation between the O5'-H and the 3'-phosphate dianion at higher pHs. Employing time-dependent density functional theory [TD-DFT, B3LYP/6-31G(d)], we show that, in the excited state, the hole transfers to the sugar moiety and has significant hole localization at the C5'-site in a number of allowed transitions. This hole localization is proposed to lead to the formation of the neutral C5'-radical (C5'*) via deprotonation.


Figures

Figure 1
Figure 1
(A) A•+, produced from Adenine moiety in Ado via one-electron oxidation by Cl2. (B) C5′•, formed via photo-excitation of A•+ in 3′-dAMP (7 M LiCl glass/D2O). (C) Isotropically simulated spectrum for C3′• in 5′-AMP with the following parameters: 1βH = 15 G, 1βH = 34 G, line-width = 8.5 G, and giso =2.0027 (see text and Table I) (D) Isotropically simulated spectrum for C3′• using two β-hydrogen hyperfine couplings (simulation parameters: C2′-βH = 41 G, C4′-βH = 17 G, line-width = 4.5 G and giso =2.0028) (see text, Table I). This C3′• characterized from Ado was found to be identical to that found for Guo.
Figure 2
Figure 2
ESR spectra of one-electron oxidized adenine formed in Ado (Black) and dAdo (red, ref. 14) respectively in H2O in 7.5 M LiCl glass (see experimental). Spectra in (A) found at pH 5. Spectra in the pH range 3 to 7 are identical. Spectra in (B) were found at pH 12 and spectra in the pH range 9 to 12 were identical. All ESR spectra are recorded at 77 K. The spectra in A and B are assigned to A•+ and its deprotonated species to A(-H)•, respectively. The Figure (insert) shows that up to pH 7, one-electron oxidized adenine in Ado remains as the cation radical, and at pH ca. 9 and above, it exists as A(-H)•. These results show that A•+ in Ado and dAdo have indentical pKa values at 150 K (ca. 8).
Figure 3
Figure 3
(A) Spectrum of A•+ in Ado in 7.5 M LiCl glass/D2O before illumination. (B) Spectrum after visible illumination at 143 K of the same sample used in (A) shows a nearly complete conversion to sugar radicals (Table II). A central doublet assigned to C5′• is present and a prominent quartet assigned to C3′• is also observed at the wings. (C) Spectrum after visible illumination at 143 K of A•+ in 1′-D-Ado. No change in spectra in B and C is noted. (D) Spectrum obtained after visible illumination at 143 K of A•+ in 2′-D-Ado. The central doublet from C5′• remains, but the end lines of the quartet assigned to C3′• are lost. (E) After visible illumination at 143 K of A•+ in 5′,5′-D,D-Ado. The central doublet assigned to C5′• has collapsed to a singlet. Photo-excitation was carried out for 140 min for each sample. All ESR spectra are recorded at 77 K.
Figure 4
Figure 4
Extent of formation of C3′• and C5′• sugar radicals by excitation of A•+ (Ado) as a function of photo-excitation time at the native pD (ca. 5) of 7.5 M LiCl/D2O at 143 K in glassy samples of Ado.
Figure 5
Figure 5
(A) ESR Spectrum from A•+ in 3′-AMP in a 7.5 M LiCl glass/D2O at pD ca. 6. (B) After illumination of A•+ in 2′-AMP for 180 min, C5′• is produced (see text). (C) Illumination of A•+ in 3′-AMP for 150 min at pD 6, this resulting spectrum is assigned to C5′•. (D) Spectrum after illumination of A•+ in 5′-AMP at pD ca. 5 for 180 min containing C3′• and C5′• found by subtraction of ca. 13% of the A•+ benchmark spectrum (Figure 1A). (E) Spectrum found after illumination of A•+ in 2′,3′-cAMP at pD ca. 5 for 180 min. This spectrum is assigned to C5′•. Each of the spectra (B), (C), (D) and (E) has an appropriate amount of A•+ spectrum (Figure 3A) subtracted (ca. 5%, 10%, 13% and 5% respectively) from the final spectra obtained after photo-excitation. All illuminations have been carried out with visible light at 143 K and all spectra were recorded at 77 K.
Figure 6
Figure 6
Spectra obtained after illumination of one-electron oxidized 3′-AMP in 7.5 M LiCl/D2O glass at pD 6, 7 and 9. The remaining A•+ has been subtracted from each spectrum. All spectra are attributed to C5′• which changes its conformation with increasing pD to show coupling to the C4′-H atom. With increase in pD of the glassy solution, the line components at the wings in spectrum become more visible (see spectrum C). Spectrum (C) is simulated (red color) using the parameters: 1αH (9.0, 15.0, 33.0) G, 1 βH (34.5, 34.5, 34.5) G, (2.0032, 2.0020, 2.0049), 4.5 G line-width with Lorentzian/Gaussian = 1.
Figure 7
Figure 7
(A) and (C) Spectra of A•+ formed in identically prepared and handled samples of 5′-AMP (Black) and 5′,5′-D,D-5′-AMP (Red) before illumination. After visible illumination (B) at 77 K and (D) at 143 K of A•+ in 5′-AMP (Black) and 5′,5′-D,D-5′-AMP (Red) respectively. The spectra (B) and (D) of sugar radical cohort in 5′-AMP samples (Black) are obtained after subtraction of the adequate amount (ca. 30% (for 77 K) and ca. 13% (for 143K)) of A•+ spectrum (Figure 1A). After visible illumination at 77 K as well as at 143 K of A•+ in 5′-D,D-5′-AMP, the central doublet from C5′• has collapsed to a singlet, but the quartet assigned to C3′• is present in the sugar radical cohort. All ESR spectra are recorded at 77 K.
Figure 8
Figure 8
B3LYP/6-31G* optimized geometries of C5′-radical in (A) mono-protonated phosphate (PO4H−1) in the presence of 4 waters and (B) deprotonated form (PO4−2) in the presence of 3 waters. The atoms O5′, C5′, H5′, and C4′ are constrained in the same plane in (A) and (B). In (A) the dihedral angle H4′-C4′-C5′-O5″ was constrained to 0° whereas in (B) it is 54°. Figures (C) and (D) are the exposed views of the atoms O5′, C5′, H5′, and C4′ shown in Figures (A) and (B). Figure (C) shows that the C4′-H atom in Figure (A) is in the nodal plane of the p-orbital of C5′-radical; whereas, Figure (D) points out that it is lifted significantly out of the nodal plane and results in a large beta proton hyperfine coupling from the C4′-H atom in the C5′-radical.
Figure 9
Figure 9
Representative TD-B3LYP/6-31G(d) calculated electronic transition (10th) occurring from inner core doubly occupied molecular orbital (62β) to 70 β SOMO (singly occupied molecular orbital). This transition as most others show significant hole localization at C5′ in the excited state. After the transition the lower figure represents the SOMO showing the hole moves from base to sugar.
Scheme 1
Scheme 1
Isotopically substituted compounds used:
Scheme 2
Scheme 2
Radicals described in this work.
Scheme 3
Scheme 3
Formation of a sugar radical e.g., C5′• via photo-excited A•+.

References

    1. Shukla LI, Pazdro R, Huang J, DeVreugd C, Becker D, Sevilla MD. Radiation Research. 2004;161:582–590. - PubMed
    1. Adhikary A, Malkhasian AYS, Collins S, Koppen J, Becker D, Sevilla MD. Nucleic Acids Res. 2005;32:5553–5564. - PMC - PubMed
    1. Adhikary A, Kumar A, Sevilla MD. Radiation Research. 2006;165:479–484. - PubMed
    1. Adhikary A, Collins S, Khanduri D, Sevilla MD. J Phys Chem B. 2007;111:7415–7421. - PMC - PubMed
    1. Kumar A, Sevilla MD. J Phys Chem B. 2006;110:24181–24188. - PMC - PubMed

Publication types