

Population genomics of the inbred Scandinavian wolf
- PMID: 19368642
- PMCID: PMC2747086
- DOI: 10.1111/j.1365-294X.2009.04120.x
Population genomics of the inbred Scandinavian wolf
Abstract
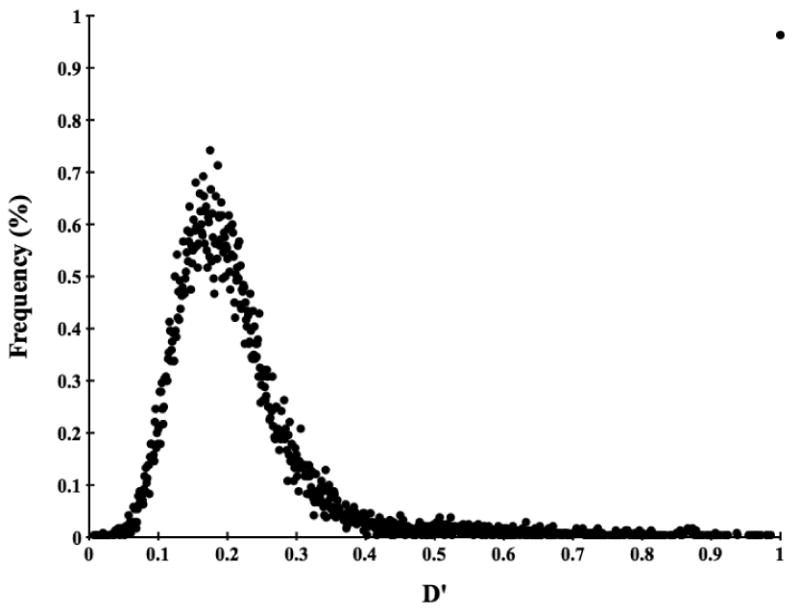
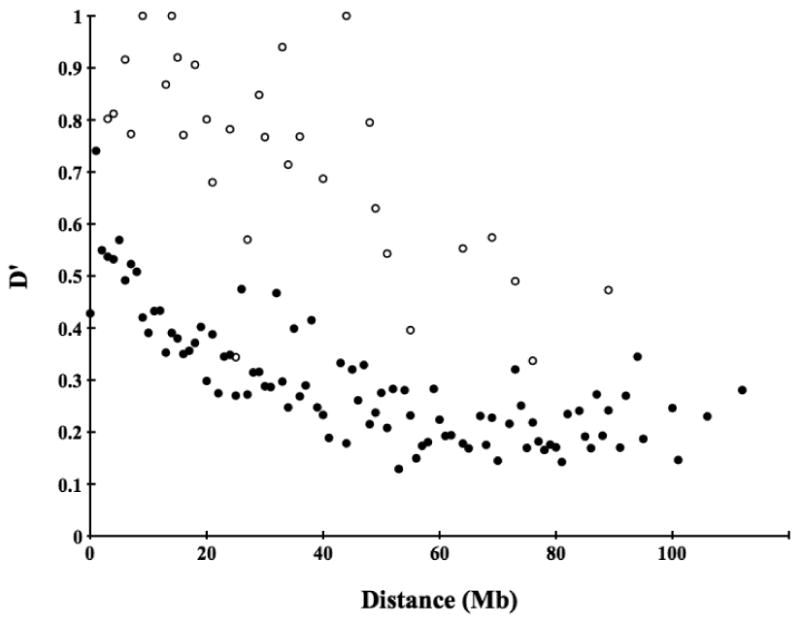
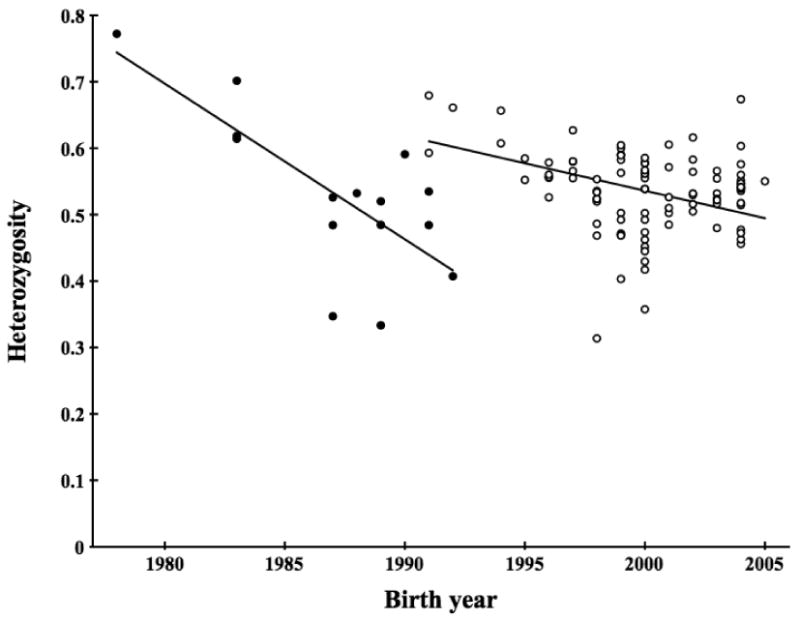
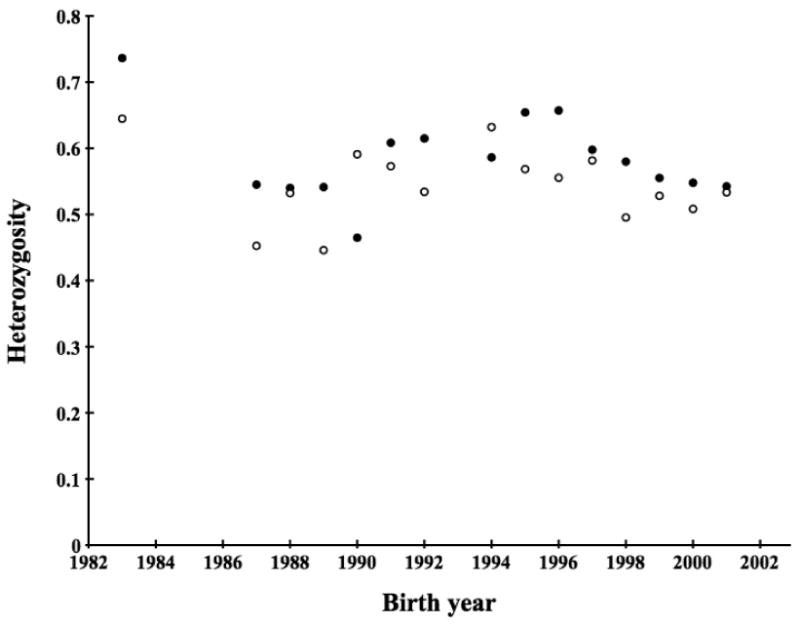
The Scandinavian wolf population represents one of the genetically most well-characterized examples of a severely bottlenecked natural population (with only two founders), and of how the addition of new genetic material (one immigrant) can at least temporarily provide a 'genetic rescue'. However, inbreeding depression has been observed in this population and in the absence of additional immigrants, its long-term viability is questioned. To study the effects of inbreeding and selection on genomic diversity, we performed a genomic scan with approximately 250 microsatellite markers distributed across all autosomes and the X chromosome. We found linkage disequilibrium (LD) that extended up to distances of 50 Mb, exceeding that of most outbreeding species studied thus far. LD was particularly pronounced on the X chromosome. Overall levels of observed genomic heterozygosity did not deviate significantly from simulations based on known population history, giving no support for a general selection for heterozygotes. However, we found evidence supporting balancing selection at a number of loci and also evidence suggesting directional selection at other loci. For markers on chromosome 23, the signal of selection was particularly strong, indicating that purifying selection against deleterious alleles may have occurred even in this very small population. These data suggest that population genomics allows the exploration of the effects of neutral and non-neutral evolution on a finer scale than what has previously been possible.
Figures
Similar articles
-
Selection for heterozygosity gives hope to a wild population of inbred wolves.PLoS One. 2006 Dec 20;1(1):e72. doi: 10.1371/journal.pone.0000072. PLoS One. 2006. PMID: 17183704 Free PMC article.
-
Rescue of a severely bottlenecked wolf (Canis lupus) population by a single immigrant.Proc Biol Sci. 2003 Jan 7;270(1510):91-7. doi: 10.1098/rspb.2002.2184. Proc Biol Sci. 2003. PMID: 12590776 Free PMC article.
-
A temporal analysis shows major histocompatibility complex loci in the Scandinavian wolf population are consistent with neutral evolution.Proc Biol Sci. 2004 Nov 7;271(1554):2283-91. doi: 10.1098/rspb.2004.2869. Proc Biol Sci. 2004. PMID: 15539354 Free PMC article.
-
From high masked to high realized genetic load in inbred Scandinavian wolves.Mol Ecol. 2023 Apr;32(7):1567-1580. doi: 10.1111/mec.16802. Epub 2022 Dec 13. Mol Ecol. 2023. PMID: 36458895
-
Inbreeding and relatedness in Scandinavian grey wolves Canis lupus.Hereditas. 1999;130(3):239-44. doi: 10.1111/j.1601-5223.1999.00239.x. Hereditas. 1999. PMID: 10509138
Cited by
-
Genomic sweep and potential genetic rescue during limiting environmental conditions in an isolated wolf population.Proc Biol Sci. 2011 Nov 22;278(1723):3336-44. doi: 10.1098/rspb.2011.0261. Epub 2011 Mar 30. Proc Biol Sci. 2011. PMID: 21450731 Free PMC article.
-
Fifteen years of genomewide scans for selection: trends, lessons and unaddressed genetic sources of complication.Mol Ecol. 2016 Jan;25(1):5-23. doi: 10.1111/mec.13339. Epub 2015 Sep 16. Mol Ecol. 2016. PMID: 26224644 Free PMC article. Review.
-
Genomics and the future of conservation genetics.Nat Rev Genet. 2010 Oct;11(10):697-709. doi: 10.1038/nrg2844. Nat Rev Genet. 2010. PMID: 20847747 Review.
-
Choosy Wolves? Heterozygote Advantage But No Evidence of MHC-Based Disassortative Mating.J Hered. 2016 Mar;107(2):134-42. doi: 10.1093/jhered/esv090. Epub 2015 Nov 25. J Hered. 2016. PMID: 26610365 Free PMC article.
-
The evolutionary history of grey wolf Y chromosomes.Mol Ecol. 2019 May;28(9):2173-2191. doi: 10.1111/mec.15054. Epub 2019 Apr 10. Mol Ecol. 2019. PMID: 30788868 Free PMC article.
References
-
- Beaumont MA, Balding DJ. Identifying adaptive genetic divergence among populations from genome scans. Molecular Ecology. 2004;13:969–980. - PubMed
Publication types
MeSH terms
Substances
Grants and funding
LinkOut - more resources
Full Text Sources
Research Materials
Miscellaneous
