. 2009 Jul;50(7):1201-14.
doi: 10.1093/pcp/pcp057. Epub 2009 Apr 15.

Highly sensitive and high-throughput analysis of plant hormones using MS-probe modification and liquid chromatography-tandem mass spectrometry: an application for hormone profiling in Oryza sativa

Affiliations

Highly sensitive and high-throughput analysis of plant hormones using MS-probe modification and liquid chromatography-tandem mass spectrometry: an application for hormone profiling in Oryza sativa

Mikiko Kojima et al. Plant Cell Physiol. 2009 Jul.

Abstract

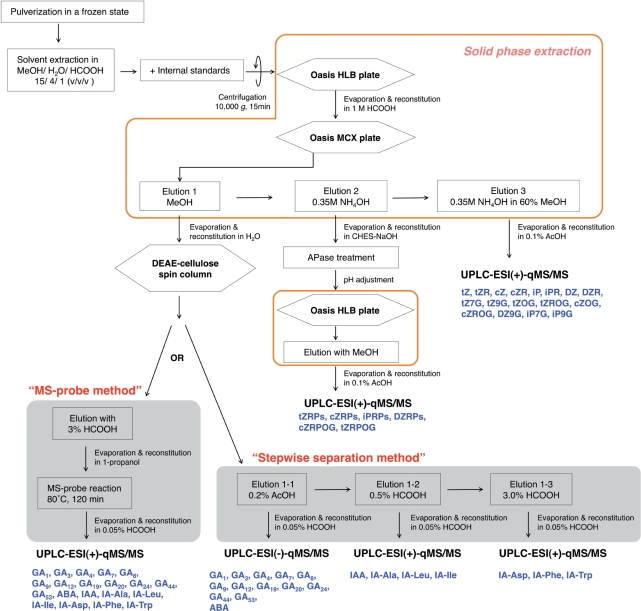
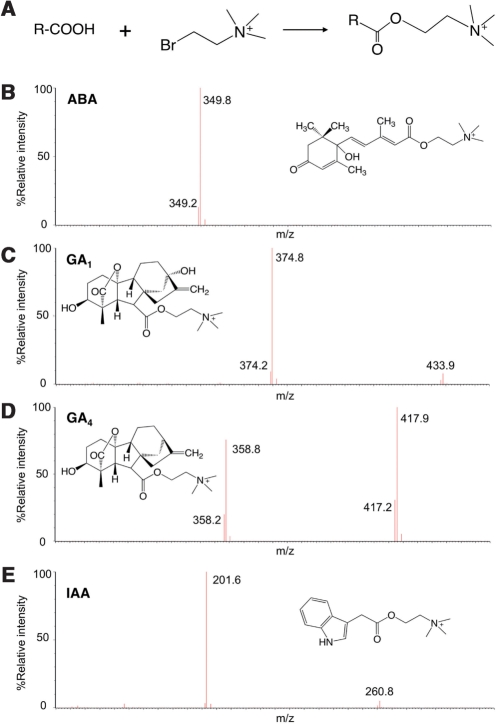
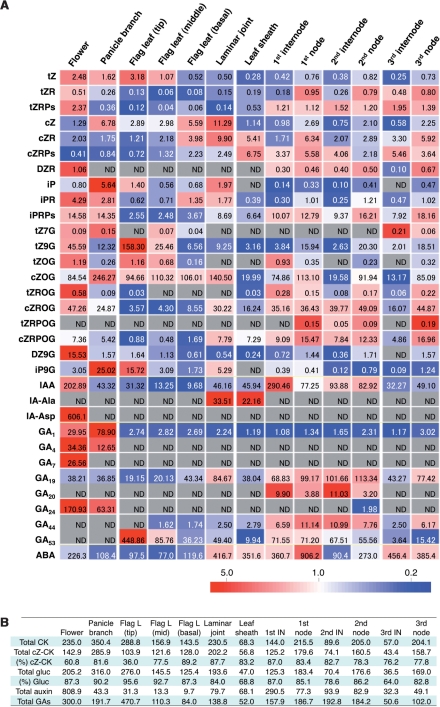
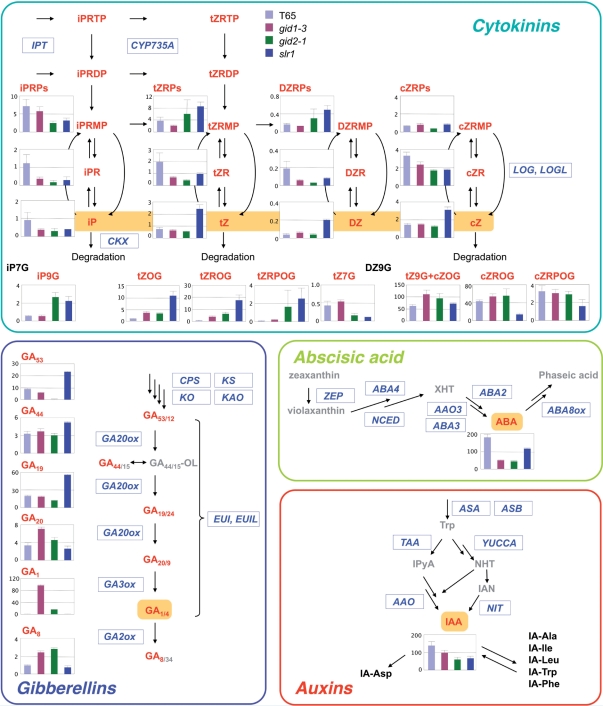
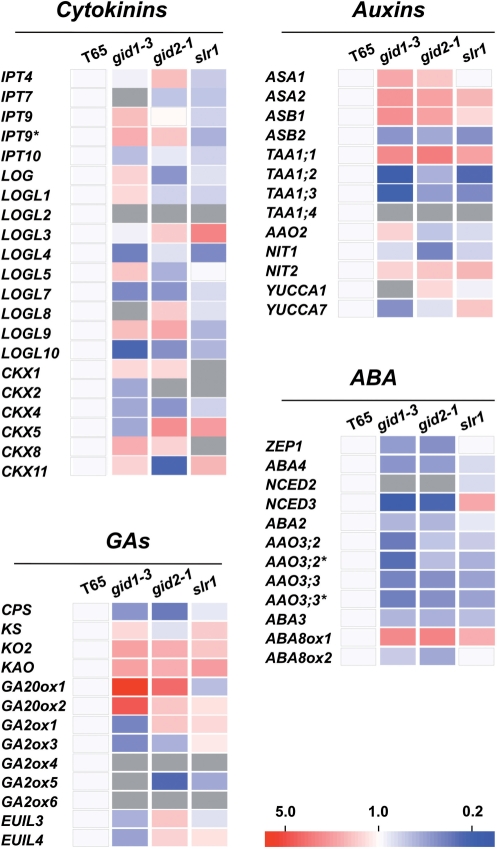
We have developed a highly sensitive and high-throughput method for the simultaneous analysis of 43 molecular species of cytokinins, auxins, ABA and gibberellins. This method consists of an automatic liquid handling system for solid phase extraction and ultra-performance liquid chromatography (UPLC) coupled with a tandem quadrupole mass spectrometer (qMS/MS) equipped with an electrospray interface (ESI; UPLC-ESI-qMS/MS). In order to improve the detection limit of negatively charged compounds, such as gibberellins, we chemically derivatized fractions containing auxin, ABA and gibberellins with bromocholine that has a quaternary ammonium functional group. This modification, that we call 'MS-probe', makes these hormone derivatives have a positive ion charge and permits all compounds to be measured in the positive ion mode with UPLC-ESI-qMS/MS in a single run. Consequently, quantification limits of gibberellins increased up to 50-fold. Our current method needs <100 mg (FW) of plant tissues to determine phytohormone profiles and enables us to analyze >180 plant samples simultaneously. Application of this method to plant hormone profiling enabled us to draw organ distribution maps of hormone species in rice and also to identify interactions among the four major hormones in the rice gibberellin signaling mutants, gid1-3, gid2-1 and slr1. Combining the results of hormone profiling data with transcriptome data in the gibberellin signaling mutants allows us to analyze relationships between changes in gene expression and hormone metabolism.


Figures

Fig. 1
Fig. 1
Schematic representation of the extraction and purification protocol for the high-throughput and highly sensitive hormone analysis system. Hexagonal boxes represent a separation column, quadrangular boxes represent other handling processes. Processes enclosed in orange lines are performed with an automated liquid handling system for solid phase extraction. Compounds analyzed in each UPLC-ESI-qMS/MS are shown in blue letters. AcOH, acetic acid; APase, alkaline phosphatase; CHES, N-cyclohexyl-2-aminoethanesulfonic acid; MeOH, methanol; tZ, trans-zeatin; tZR, tZ riboside; cZ, cis-zeatin; cZR, cZ riboside; iP, N6-(Δ2-isopentenyl)adenine; iPR, iP riboside; DZ, dihydrozeatin; DZR, DZ riboside; tZ7G, tZ-7-N-glucoside; tZ9G, tZ-9-N-glucoside; tZOG, tZ-O-glucoside; tZROG, tZR-O-glucoside; cZOG, cZ-O-glucoside; cZROG, cZR-O-glucoside; DZ9G, DZ-9-N-glucoside; iP7G, iP-7-N-glucoside; iP9G, iP-9-N-glucoside; tZRPs, tZR phosphates; cZRPs, cZR phosphates; iPRPs, iPR phosphates; DZRPs, DZR phosphates; cZRPOG, cZR phosphate-O-glucoside; tZRPOG, tZR phosphate-O-glucoside; IA-Ala, indole-3-acetyl-l-Ala; IA-Leu, indole-3-acetyl-l-Leu; IA-Ile, indole-3-acetyl-l-Ile; IA-Asp, indole-3-acetyl-l-Asp; IA-Phe, indole-3-acetyl-l-Phe; IA-Trp, indole-3-acetyl-l-Trp.
Fig. 2
Fig. 2
MS-probe derivatization. (A) Structure of the MS-probe and its derivatized product after reaction with the analyte. (B–E) Structures of derivatized products and their fragmentation patterns for ABA (B), GA1 (C), GA4 (D) and IAA (E) that were analyzed with a Quattro Premier XE (Waters) in the positive ion mode.
Fig. 3
Fig. 3
Organ distribution of plant hormone species in rice. (A) Heat map of organ distribution of plant hormones. Flower, panicle branch, tip, middle and basal regions, laminar joint, and leaf sheath of the flag leaf, first internode, first node, second internode, second node, third internode and third node of rice (cv. ‘Nipponbare’) were harvested after growth in a greenhouse to the flowering stage. The concentrations of the hormone species were analyzed. The relative accumulation patterns are shown in the heat map based on the average value for each plant hormone species. Red and blue colors indicate higher and lower concentrations, respectively. The color scale is shown at the bottom. Hormone species whose concentrations were under the quantification limit in all organs are not shown in the heat map. The value in each block is the concentration (average value, n = 3) as pmol g1 FW. ND, not detected under the quantification limit. (B) Total amount of cytokinins (Total CK), cZ-type cytokinins (Total cZ-CK), cytokinin glucosides (Total gluc), auxins (Total auxin) and gibberellin (Total GAs) in the results of A are shown as pmol g1 FW. The proportions of cZ-type cytokinins [(%) cZ-CK] and cytokinin glucosides [(%) Gluc] are indicated as percentage values. Flag L, flag leaf; mid, middle; IN, internode.
Fig. 4
Fig. 4
Endogenous levels of cytokinins, gibberellin, ABA and auxins in a wild-type and gibberellin signaling mutants. Shoots of the wild type (T65) and gid1-3, gid2-1 and slr1 were harvested after growth in a greenhouse for 5 weeks. The amounts of the hormones are shown as histograms with the SD (n = 3). The y-axis is concentration as pmol g1 FW. Hormone species and other compounds in gray were not measured, and those in black were under the quantification limit. The overall recoveries of analyzed stable isotope-labeled internal standards are presented in Supplementary Table S7. Genes involved in each metabolic process are indicated in italic blue letters surrounded by a rectangle. The details of each metabolic pathway are described by Hirano et al. (2008). GA44/15-OL, GA44/15-open lactone; XHT, xanthoxin; IpyA, indole-3-pyruvic acid; NHT, N-hydroxyl-tryptamine; IAN, indole-3-acetonitrile; IPT, adenosine phosphate-isopentenyltransferase; CKX, OsCKX; CPS, ent-copalyl diphosphate synthase; KS, ent-kaurene synthase; KO, ent-kaurene oxidase; KAO, ent-kaurenoic acid oxidase; EUIL, EUI-like; ZEP, OsZEP; NCED, OsNCED; AAO, OsAAO; ASA, OsASA; ASB, OsASB; TAA, OsTAA; YUCCA, OsYUCCA; NIT, OsNIT.
Fig. 5
Fig. 5
Heat map view of expression of genes involved in hormone metabolism in the gibberellin signaling mutants, gid1-3, gid2-1 and slr1, and the wild-type ‘Taichung 65’. Hormone metabolism genes with reliable expression data in at least ‘Taichung 65’ were selected from Supplementary Table S4. The relative expression level of each gene compared with expression in ‘Taichung 65’ is shown on the heat map. Red and blue colors indicate higher and lower expression, respectively. The color scale is shown at the bottom. Gray indicates expression data of lower reliability. One of the multiple Affymetrix probes for one gene is marked with an asterisk. T65, ‘Taichung 65’. Abbreviations of genes are shown in the legend to Fig. 4 and the main text.

References

    1. Bai F, DeMason D. Hormone interactions and regulation of Unifoliata, PsPK2, PsPIN1 and LE gene expression in pea (Pisum sativum) shoot tips. Plant Cell Physiol. 2006;47:935–948. - PubMed
    1. Cary AJ, Liu W, Howell SH. Cytokinin action is coupled to ethylene in its effects on the inhibition of root and hypocotyl elongation in Arabidopsis thaliana seedlings. Plant Physiol. 1995;107:1075–1082. - PMC - PubMed
    1. Chiwocha SD, Abrams SR, Ambrose SJ, Cutler AJ, Loewen M, Ross AR, et al. A method for profiling classes of plant hormones and their metabolites using liquid chromatography–electrospray ionization tandem mass spectrometry: an analysis of hormone regulation of thermodormancy of lettuce (Lactuca sativa L.) seeds. Plant J. 2003;35:405–417. - PubMed
    1. Chow B, McCourt P. Plant hormone receptors: perception is everything. Genes Dev. 2006;20:1998–2008. - PubMed
    1. Davies PJ, editor. Plant Hormones. Dordrecht: Kluwer Academic Publishers; 2004. Biosynthesis, Signal Transduc-tion, Action.

Publication types

MeSH terms