

doi: 10.1128/JVI.00081-09.
Epub 2009 Apr 15.
Enumeration of an extremely high particle-to-PFU ratio for Varicella-zoster virus
Affiliations
- PMID: 19369328
- PMCID: PMC2698559
- DOI: 10.1128/JVI.00081-09
Item in Clipboard
Enumeration of an extremely high particle-to-PFU ratio for Varicella-zoster virus
J Virol.
2009 Jul.
Abstract
Varicella-zoster virus (VZV) is renowned for its low titers. Yet investigations to explore the low infectivity are hampered by the fact that the VZV particle-to-PFU ratio has never been determined with precision. Herein, we accomplish that task by applying newer imaging technology. More than 300 images were taken of VZV-infected cells on 4 different samples at high magnification. We enumerated the total number of viral particles within 25 cm(2) of the infected monolayer at 415 million. Based on these numbers, the VZV particle:PFU ratio was approximately 40,000:1 for a cell-free inoculum.
Figures
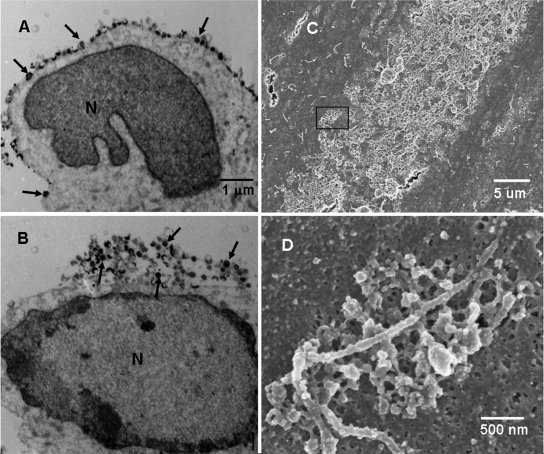
Potential cell-free VZV on the surfaces of infected cells. Melanoma cells were inoculated with VZV-32-infected cells (1:8), fixed at 72 h postinfection, and then processed for viewing in transmission and scanning electron microscopes. Representative transmission electron microscopy sections (A and B) through VZV-infected cells showed the majority of VZV particles are on or near the surface of the infected cell rather than in the cytoplasm. Particles with discernible cores (capsid and DNA) are marked by black arrows. (C) SEM image of a section of a viral highway at magnification ×3,500. Small viral particles were clustered within the highway. (D) Image at magnification ×35,000 of the area enclosed by the rectangle in panel C. The image shows a single cluster of viral particles arranged along a filopodium. The majority of the visible particles were aberrant. N, nucleus.
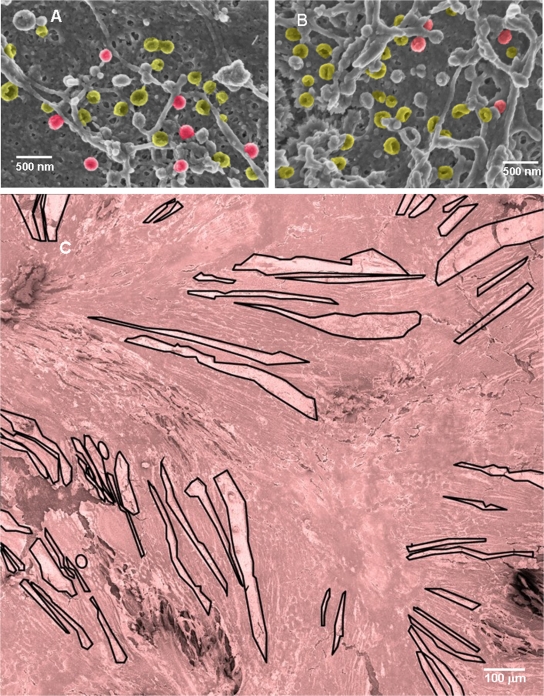
Representative SEM images from the set used to estimate the number of viral particles on infected cells. (A and B) Two images that are representative of 303 SEM images at magnification ×35,000, taken of various sections of viral highways in four different samples. Panel A contains 26 particles: 6 are complete; 20 are L particles. Panel B contains 29 particles: 4 are complete; 25 are L particles. The density of viral particles in panels A and B was 2.9 and 3.3 particles/μm2, respectively. L particles are pseudocolored yellow; complete particles are red. (C) Forty-eight overlapping images of three different areas of each sample were taken at magnification ×600 and then pieced together to make 12 individual montages that each show approximately 1 mm2 of infected cell surface. One of the montages (S1-A) is shown, with all viral highways measured in this study outlined in black. It is pseudocolored red. Full-size versions of all 12 montages are available in the supplemental material.
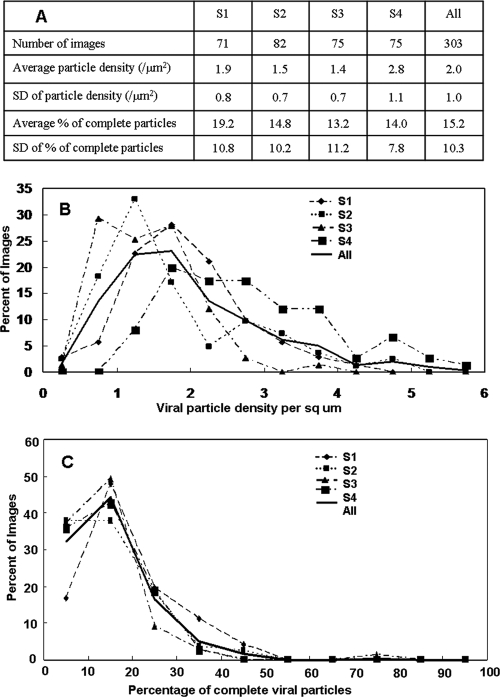
Density and composition of viral particles on VZV-infected cells. (A) Statistical analysis of viral particle density and composition for all four samples. (B) Percentage of images that had a particular viral particle density for all four samples separately and then all images grouped together. The graph shows skewed normal distributions centered around 1.8 particles/μm2 with a range up to 4.0. The distribution was similar for all four samples. (C) Percentage of images that had a particular percentage of complete particles. The graph also shows a skewed normal distribution centered around 15% complete particles, with a range up to 40% complete particles.
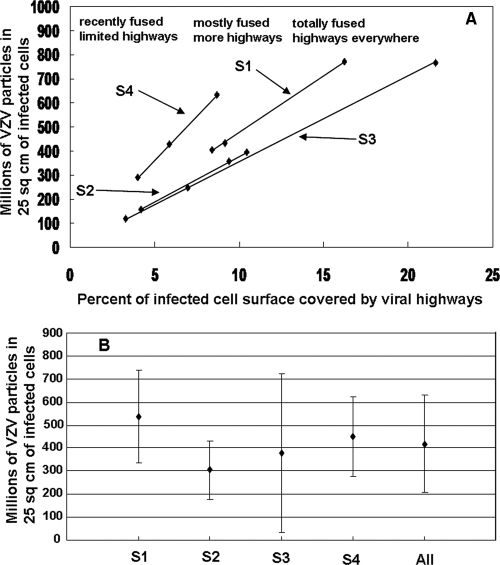
Enumeration of VZV particles in 25 cm2 of infected cells. Measurements of viral highways in 12 montages of infected cells (Fig. 2C; see also the supplemental material) were used to determine the area of infected cell surface covered by viral highways in each montage. Multiplying the area by the viral particle density calculated for each sample yielded an estimate for the total number of VZV particles in 25 cm2. (A) Graph of estimated particle numbers versus percentage of area covered by viral highways. The slope of each line in the graph corresponds to the viral particle density of the sample. The data points showed the considerable variability of viral egress in individual mm2 of infected cell surface. (B) Graph of average particle number versus sample. The data points for each sample were derived by averaging the three measurements for each sample. The All data point was the result of averaging all 12 measurements. The error bars correspond to standard deviations. The average number of VZV particles in 25 cm2 was 415 million ± 200 million.
References
-
- Anderson, D., D. Sweeney, and T. Williams. 1986. Statistics: concepts and applications. West Publishing Company, St. Paul, MN.
-
- Brunell, P. A. 1967. Separation of infectious varicella-zoster virus from human embryonic lung fibroblasts. Virology 31732-734. - PubMed
-
- Cohen, J. I. 2001. Mutagenesis of the varicella-zoster virus genome: lessons learned. Arch. Virol. 2001 (Suppl.)91-97. - PubMed
Publication types
MeSH terms
Grants and funding
LinkOut - more resources
Full Text Sources
Other Literature Sources
