. 2009 Jun;83(12):6234-46.
doi: 10.1128/JVI.00282-09. Epub 2009 Apr 15.

Simultaneous cell-to-cell transmission of human immunodeficiency virus to multiple targets through polysynapses

Affiliations

Simultaneous cell-to-cell transmission of human immunodeficiency virus to multiple targets through polysynapses

Dominika Rudnicka et al. J Virol. 2009 Jun.

Abstract

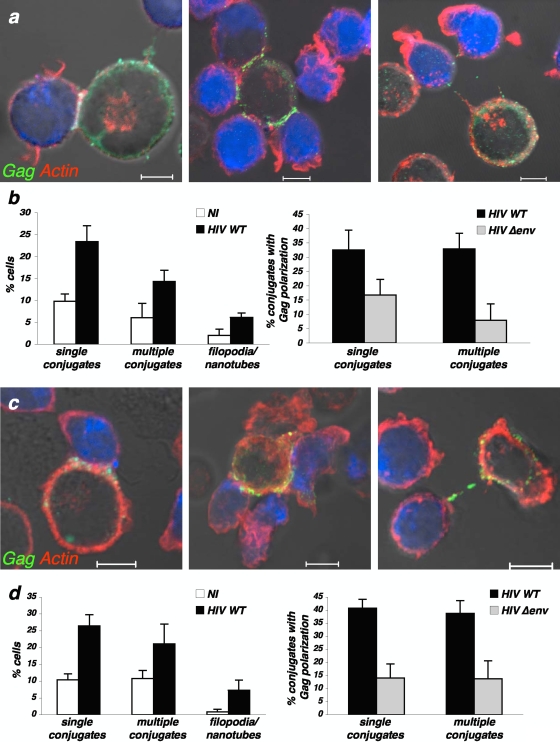
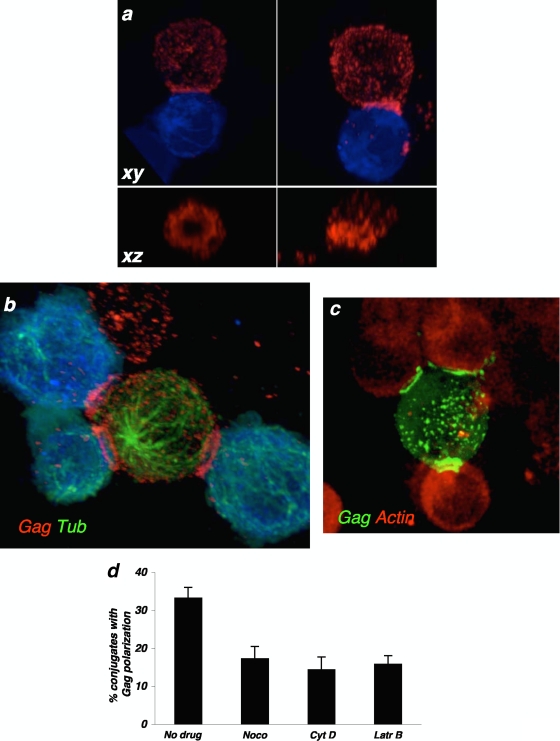
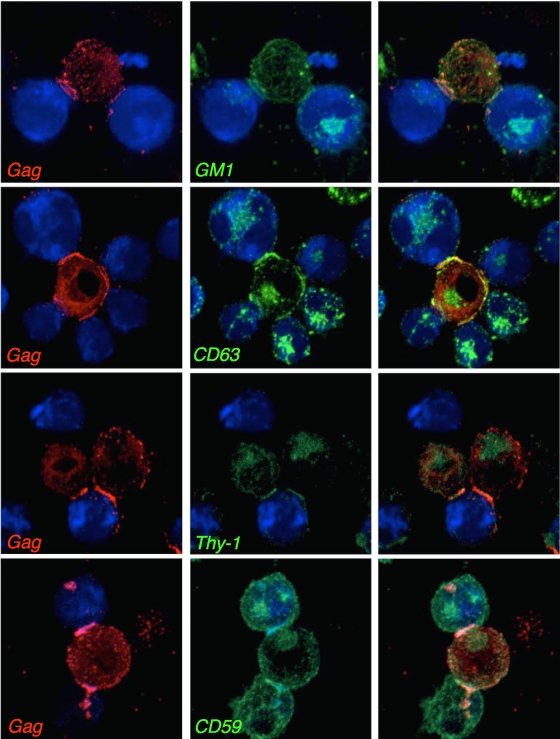
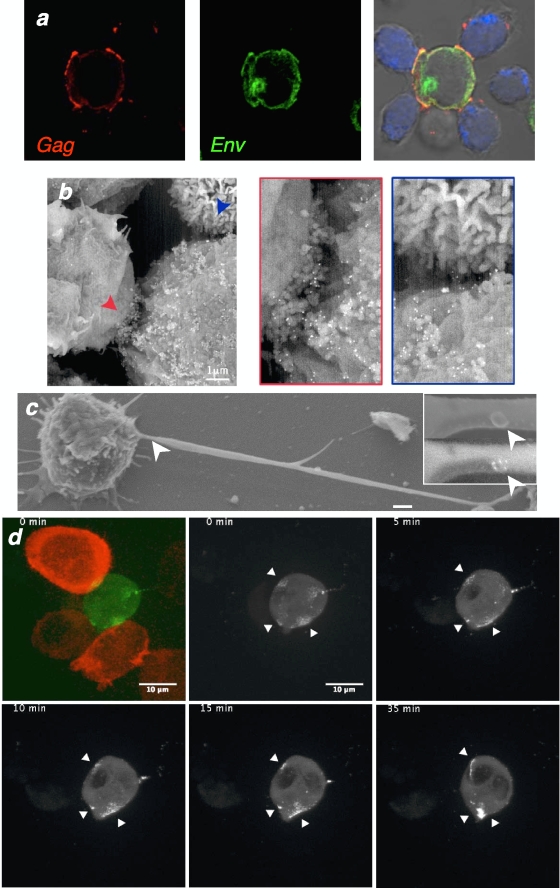
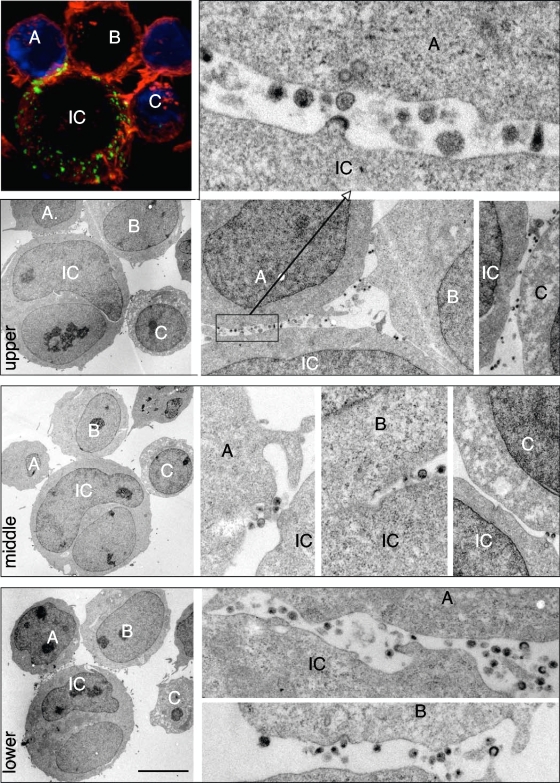
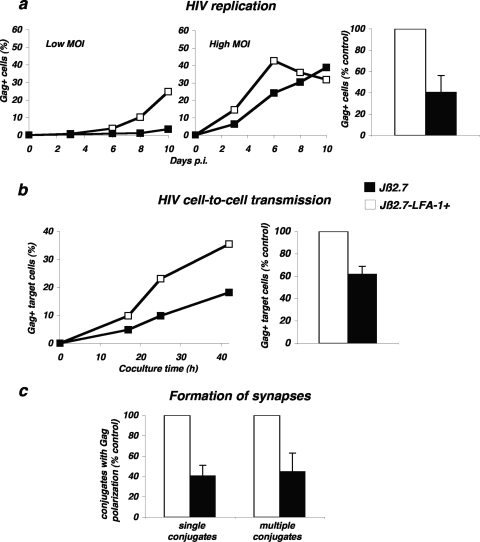
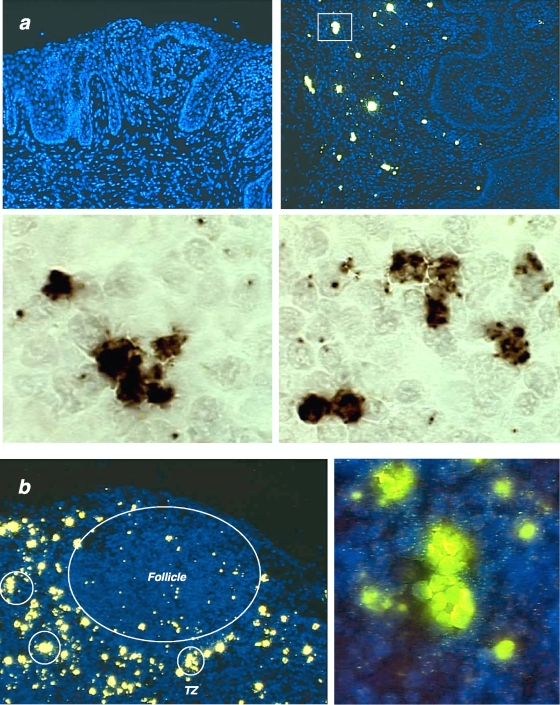
Human immunodeficiency virus type 1 (HIV-1) efficiently propagates through cell-to-cell contacts, which include virological synapses (VS), filopodia, and nanotubes. Here, we quantified and characterized further these diverse modes of contact in lymphocytes. We report that viral transmission mainly occurs across VS and through "polysynapses," a rosette-like structure formed between one infected cell and multiple adjacent recipients. Polysynapses are characterized by simultaneous HIV clustering and transfer at multiple membrane regions. HIV Gag proteins often adopt a ring-like supramolecular organization at sites of intercellular contacts and colocalize with CD63 tetraspanin and raft components GM1, Thy-1, and CD59. In donor cells engaged in polysynapses, there is no preferential accumulation of Gag proteins at contact sites facing the microtubule organizing center. The LFA-1 adhesion molecule, known to facilitate viral replication, enhances formation of polysynapses. Altogether, our results reveal an underestimated mode of viral transfer through polysynapses. In HIV-infected individuals, these structures, by promoting concomitant infection of multiple targets in the vicinity of infected cells, may facilitate exponential viral growth and escape from immune responses.


Figures

FIG. 1.
FIG. 1.
Distinct modes of contact between HIV-1-infected cells and targets. (a and b) Jurkat cells; (c and d) primary CD4+ T cells. (a and c) Confocal images illustrating classical virological synapses (left), polysynapses (middle), and remote contacts through filopodial bridges or nanotube-like structures (right). HIV-1-infected cells were mixed with Far Red dye-labeled recipients (blue) for 1 h and stained for HIV-1 Gag (green) and F-actin (red). The scale bar represents 5 μm. (a) Jurkat cells; (c) primary CD4+ T cells. (b and d) Quantification of the various types of contacts. (Left) Noninfected (NI) or HIV-1-infected cells were cocultivated with targets, and the indicated types of contacts were scored. (Right) Quantification of HIV-infected cells (HIV wild type [WT] or Δenv mutant) displaying Gag clustering at the junction zone with targets. Data are means ± standard deviations of four independent experiments. A total of 1,685 NI cells and 1,247 WT HIV- and 1,137 Δenv-mutant-infected Jurkat cells were analyzed in panel b, and 1,646 NI cells and 693 WT HIV- and 522 Δenv mutant-infected primary CD4+ T cells were analyzed in panel d.
FIG. 2.
FIG. 2.
Characteristics of virological polysynapses. Conjugates between infected cells and targets (blue) were stained with anti-Gag (a) or with anti-Gag and antitubulin (Gag Tub) (b). (a) Representative images of single synapses, in which Gag proteins adopt (left panel) or do not adopt (right panel) a ring-like structure at the junction zone. A magnification of the junction, on the xz axis, is shown in the lower panels. (b) Example of a polysynapse, with a single donor interacting simultaneously with three targets. The image is a snapshot from movie S1 in the supplemental material. (c) Example of a polysynapse, between one cell infected with an infectious HIV strain carrying a Gag-GFP fusion protein and targets harboring an actin-RFP fusion. Gag localization is revealed by GFP. (d) Effects of inhibitors of actin (1 μM each cytochalasin D [Cyt D] and latrunculin B [Latr B]) and microtubule (1 μM nocodazole [Noco]) remodeling on the recruitment of Gag at polysynapses. Data are means ± standard deviations of three independent experiments (with 604 to 1,232 infected cells analyzed, depending on the treatment).
FIG. 3.
FIG. 3.
Localization of cellular molecules in virological polysynapses. Conjugates between infected cells and targets (blue) were stained with anti-Gag (red) and with either the GM1 raft marker, anti-CD63, anti-Thy-1, or anti-CD59 MAbs. Representative images of polysynapses from at least three independent experiments are shown. Right panels are merged images of the left and middle panels.
FIG. 4.
FIG. 4.
HIV budding and accumulation at the sites of cell-cell connections. (a) Localization of Gag (red) and Env (green) viral proteins in virological polysynapses, analyzed as described in the legend to Fig. 1. (b and c) SEM views of HIV-infected Jurkat cells (b) or primary CD4+ cells (c) mixed with uninfected cells for 1 h. HIV-1 virions are stained with anti-Env MAb coupled to gold particles (appearing as white dots). Representative images of polysynapses (b) and of long cellular protrusions carrying Env+ virus-like particles (c) are depicted. The regions pointed at by arrows in the left panels are magnified in the right boxes. In panel c, the inserts illustrate a virus-like particle (upper panel), with a compact Env signal (lower panel). (d) Real-time imaging of Gag movements toward two targets. The infected cell (green) carries an HIV Gag.eGFP virus. The two target cells are stained in red (left panel). Gag movements are analyzed at the indicated time points. Images are snapshots from Movie S2 in the supplemental material. The arrows indicate zones of intercellular contacts.
FIG. 5.
FIG. 5.
Analysis of polysynapses by correlative IF-TEM. HIV-1-infected Jurkat cells were mixed with Far Red dye-labeled Jurkat recipients (blue) for 1 h and stained for HIV-1 Gag (green) and F-actin (red). Samples were placed on a grid with a coordinate system to locate the regions of interest. In the upper left panel, a conjugate formed between one infected cell (IC) and three target cells (labeled A, B, and C) is visualized by confocal microscopy. Samples were then sectioned, and the same conjugate was analyzed by TEM. Three sections, at 0.5 to 1-μm intervals (z axis), are depicted on the three lower left panels. They correspond approximately to the upper, middle, and lower regions of the conjugate. Various magnifications of the intercellular contact zones are depicted in the right panels. The scale bar represents 5 μm.
FIG. 6.
FIG. 6.
Role of LFA-1 during HIV replication and cell-to-cell transfer. (a) HIV replication is impaired in LFA-1-defective Jurkat cells. Cells of the Jurkat derivative Jβ2.7 (which lacks LFA-1) and Jβ2.7-LFA-1+ cells were exposed to HIV (NL4-3 strain), at either a low (5 ng/106 cells/ml) or high (50 ng/106 cells/ml) MOI. Viral replication was followed by measuring the percentage of Gag+ cells by flow cytometry at the indicated days postinfection (p.i.). A representative experiment is shown in the left panel. The mean ± standard deviation of three independent experiments is depicted in the right panel, with 100% corresponding to values obtained in Jβ2.7-LFA1+ cells at the peak at all MOIs. (b) HIV cell-to-cell transfer analyzed by flow cytometry. Productively HIV-infected Jβ2.7-LFA1+ and Jβ2.7 cells (about 25% Gag+) were cocultivated with target CFSE+ Jurkat cells at a 1/10 ratio. The percentage of Gag+ cells among targets (CFSE+) is shown at the indicated times of coculture. A representative experiment is shown on the left. The mean ± standard deviation of four independent experiments (16-h time point, with the donor/recipient ratio varying from 1/3 to 1/10) is depicted in the right panel, with 100% corresponding to values obtained in Jβ2.7-LFA1+ cells. (c) Formation of single VS and polysynapses. Productively HIV-infected Jβ2.7-LFA1+ and Jβ2.7 cells (about 25 to 40% Gag+) were cocultivated for 1 h with the target Far Red dye-labeled Jurkat cells. Single and multiple conjugates displaying Gag clustering at the junction zone with targets were scored. Data are means ± standard deviations of four independent experiments, with 100% corresponding to values obtained in Jβ2.7-LFA1+ cells (with totals of 535 Jβ2.7-LFA1+ and 592 Jβ2.7-infected cells analyzed).
FIG. 7.
FIG. 7.
Detection of clusters of infected cells in macaque tissues 12 days after vaginal inoculation of SIV. SIV RNA was detected by in situ hybridization and tyramide signal amplification with subsequent staining with fluorescent ELF (enzyme-labeled fluorescence; yellow signal) or DAB (3,3′-diaminobenzidine; brown signal) substrates. (a) Analysis of the ectocervix. (Upper left panel) Hybridization with a sense probe as a negative control; (upper right panel), antisense probe, detection of SIV RNA+ large activated and smaller “resting” CD4 T cells, and clusters of infected cells (one such cluster is enclosed by rectangle). At higher magnification (lower panels), the clusters consist of two to six SIV RNA+ cells. (b) Analysis of an axillary lymph node. The follicle and T-cell zone (TZ) are indicated on the left panel. Clusters of infected cells in the TZ are encircled. (Right panel) Clusters at higher magnification.

References

    1. Alfsen, A., H. Yu, A. Magerus-Chatinet, A. Schmitt, and M. Bomsel. 2005. HIV-1-infected blood mononuclear cells form an integrin- and agrin-dependent viral synapse to induce efficient HIV-1 transcytosis across epithelial cell monolayer. Mol. Biol. Cell 164267-4279. - PMC - PubMed
    1. Arthos, J., C. Cicala, E. Martinelli, K. Macleod, D. Van Ryk, D. Wei, Z. Xiao, T. D. Veenstra, T. P. Conrad, R. A. Lempicki, S. McLaughlin, M. Pascuccio, R. Gopaul, J. McNally, C. C. Cruz, N. Censoplano, E. Chung, K. N. Reitano, S. Kottilil, D. J. Goode, and A. S. Fauci. 2008. HIV-1 envelope protein binds to and signals through integrin alpha4beta7, the gut mucosal homing receptor for peripheral T cells. Nat. Immunol. 9301-309. - PubMed
    1. Chen, P., W. Hübner, M. A. Spinelli, and B. K. Chen. 2007. Predominant mode of human immunodeficiency virus transfer between T cells is mediated by sustained Env-dependent neutralization-resistant virological synapses. J. Virol. 8112582-12595. - PMC - PubMed
    1. Depoil, D., R. Zaru, M. Guiraud, A. Chauveau, J. Harriague, G. Bismuth, C. Utzny, S. Muller, and S. Valitutti. 2005. Immunological synapses are versatile structures enabling selective T cell polarization. Immunity 22185-194. - PubMed
    1. Dixit, R., V. Tiwari, and D. Shukla. 2008. Herpes simplex virus type 1 induces filopodia in differentiated P19 neural cells to facilitate viral spread. Neurosci. Lett. 440113-118. - PMC - PubMed

Publication types

MeSH terms

Substances