

Four histone variants mark the boundaries of polycistronic transcription units in Trypanosoma brucei
- PMID: 19369410
- PMCID: PMC2682952
- DOI: 10.1101/gad.1790409
Four histone variants mark the boundaries of polycistronic transcription units in Trypanosoma brucei
Abstract
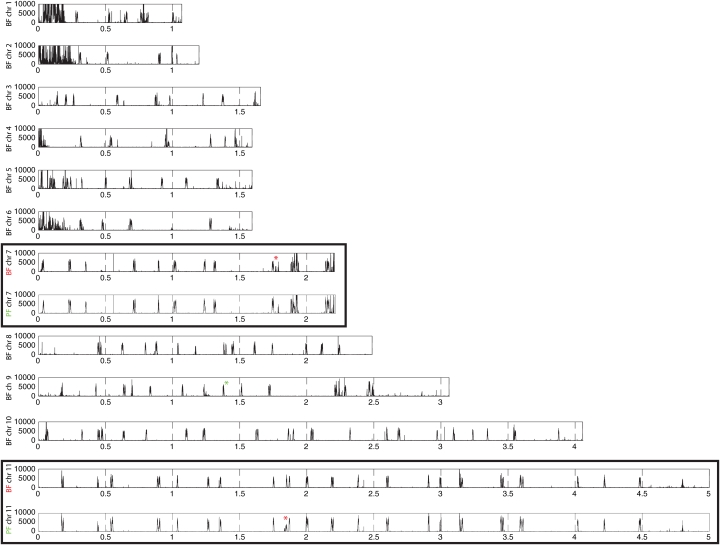
Unusually for a eukaryote, genes transcribed by RNA polymerase II (pol II) in Trypanosoma brucei are arranged in polycistronic transcription units. With one exception, no pol II promoter motifs have been identified, and how transcription is initiated remains an enigma. T. brucei has four histone variants: H2AZ, H2BV, H3V, and H4V. Using chromatin immunoprecipitation (ChIP) and sequencing (ChIP-seq) to examine the genome-wide distribution of chromatin components, we show that histones H4K10ac, H2AZ, H2BV, and the bromodomain factor BDF3 are enriched up to 300-fold at probable pol II transcription start sites (TSSs). We also show that nucleosomes containing H2AZ and H2BV are less stable than canonical nucleosomes. Our analysis also identifies >60 unexpected TSS candidates and reveals the presence of long guanine runs at probable TSSs. Apparently unique to trypanosomes, additional histone variants H3V and H4V are enriched at probable pol II transcription termination sites. Our findings suggest that histone modifications and histone variants play crucial roles in transcription initiation and termination in trypanosomes and that destabilization of nucleosomes by histone variants is an evolutionarily ancient and general mechanism of transcription initiation, demonstrated in an organism in which general pol II transcription factors have been elusive.
Figures


Comment in
-
Chromatin-based transcriptional punctuation.Genes Dev. 2009 May 1;23(9):1037-41. doi: 10.1101/gad.1806409. Genes Dev. 2009. PMID: 19417102
Similar articles
-
Histone H3 trimethylated at lysine 4 is enriched at probable transcription start sites in Trypanosoma brucei.Mol Biochem Parasitol. 2010 Aug;172(2):141-4. doi: 10.1016/j.molbiopara.2010.03.013. Epub 2010 Mar 27. Mol Biochem Parasitol. 2010. PMID: 20347883 Free PMC article.
-
Histone H2AZ dimerizes with a novel variant H2B and is enriched at repetitive DNA in Trypanosoma brucei.J Cell Sci. 2005 Dec 15;118(Pt 24):5721-30. doi: 10.1242/jcs.02688. Epub 2005 Nov 22. J Cell Sci. 2005. PMID: 16303849
-
Mono-allelic epigenetic regulation of polycistronic transcription initiation by RNA polymerase II in Trypanosoma brucei.mBio. 2025 Feb 5;16(2):e0232824. doi: 10.1128/mbio.02328-24. Epub 2024 Dec 20. mBio. 2025. PMID: 39704500 Free PMC article.
-
The epigenome of Trypanosoma brucei: a regulatory interface to an unconventional transcriptional machine.Biochim Biophys Acta. 2014 Sep;1839(9):743-50. doi: 10.1016/j.bbagrm.2014.05.028. Epub 2014 Jun 3. Biochim Biophys Acta. 2014. PMID: 24942804 Free PMC article. Review.
-
Transcription of protein-coding genes in trypanosomes by RNA polymerase I.Annu Rev Microbiol. 1997;51:463-89. doi: 10.1146/annurev.micro.51.1.463. Annu Rev Microbiol. 1997. PMID: 9343357 Review.
Cited by
-
Evolutionary cell biology of chromosome segregation: insights from trypanosomes.Open Biol. 2013 May 1;3(5):130023. doi: 10.1098/rsob.130023. Open Biol. 2013. PMID: 23635522 Free PMC article. Review.
-
An ascomycete H4 variant with an unknown function.R Soc Open Sci. 2024 Feb 21;11(2):231705. doi: 10.1098/rsos.231705. eCollection 2024 Feb. R Soc Open Sci. 2024. PMID: 38384781 Free PMC article.
-
Chromatin immunoprecipitation and microarray analysis reveal that TFIIB occupies the SL RNA gene promoter region in Trypanosoma brucei chromosomes.Mol Biochem Parasitol. 2012 Dec;186(2):139-42. doi: 10.1016/j.molbiopara.2012.09.003. Epub 2012 Sep 19. Mol Biochem Parasitol. 2012. PMID: 22999857 Free PMC article.
-
Coordinated gene expression by post-transcriptional regulons in African trypanosomes.J Biol. 2009;8(11):100. doi: 10.1186/jbiol203. Epub 2009 Dec 14. J Biol. 2009. PMID: 20017896 Free PMC article. Review.
-
Trans-acting proteins regulating mRNA maturation, stability and translation in trypanosomatids.Trends Parasitol. 2011 Jan;27(1):23-30. doi: 10.1016/j.pt.2010.06.011. Epub 2010 Jul 6. Trends Parasitol. 2011. PMID: 20609625 Free PMC article. Review.
References
-
- Alibu V.P., Storm L., Haile S., Clayton C., Horn D. A doubly inducible system for RNA interference and rapid RNAi plasmid construction in Trypanosoma brucei. Mol. Biochem. Parasitol. 2005;139:75–82. - PubMed
-
- Barski A., Cuddapah S., Cui K., Roh T.Y., Schones D.E., Wang Z., Wei G., Chepelev I.K.Z. High-resolution profiling of histone methylations in the human genome. Cell. 2007;129:823–837. - PubMed
-
- Bastin P., Bagherzadeh A., Matthews K.R., Gull K. A novel epitope tag system to study protein targeting and organelle biogenesis in Trypanosoma brucei. Mol. Biochem. Parasitol. 1996;77:235–239. - PubMed
-
- Brun R., Schonenberger M. Cultivation and in vitro cloning or procyclic culture forms of Trypanosoma brucei in a semi-defined medium. Short communication. Acta Trop. 1979;36:289–292. - PubMed
Publication types
MeSH terms
Substances
Grants and funding
LinkOut - more resources
Full Text Sources
Other Literature Sources
Molecular Biology Databases
Miscellaneous