Specific and global regulation of mRNA stability during osmotic stress in Saccharomyces cerevisiae
- PMID: 19369426
- PMCID: PMC2685517
- DOI: 10.1261/rna.1435709
Specific and global regulation of mRNA stability during osmotic stress in Saccharomyces cerevisiae
Abstract
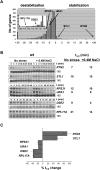
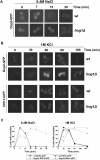
Hyperosmotic stress yields reprogramming of gene expression in Saccharomyces cerevisiae cells. Most of this response is orchestrated by Hog1, a stress-activated, mitogen-activated protein kinase (MAPK) homologous to human p38. We investigated, on a genomic scale, the contribution of changes in transcription rates and mRNA stabilities to the modulation of mRNA amounts during the response to osmotic stress in wild-type and hog1 mutant cells. Mild osmotic shock induces a broad mRNA destabilization; however, osmo-mRNAs are up-regulated by increasing both transcription rates and mRNA half-lives. In contrast, mild or severe osmotic stress in hog1 mutants, or severe osmotic stress in wild-type cells, yields global mRNA stabilization and sequestration of mRNAs into P-bodies. After adaptation, the absence of Hog1 affects the kinetics of P-bodies disassembly and the return of mRNAs to translation. Our results indicate that regulation of mRNA turnover contributes to coordinate gene expression upon osmotic stress, and that there are both specific and global controls of mRNA stability depending on the strength of the osmotic stress.
Figures


Similar articles
-
mRNA stability changes precede changes in steady-state mRNA amounts during hyperosmotic stress.RNA. 2009 Apr;15(4):600-14. doi: 10.1261/rna.1403509. Epub 2009 Feb 17. RNA. 2009. PMID: 19223440 Free PMC article.
-
Hog1 controls global reallocation of RNA Pol II upon osmotic shock in Saccharomyces cerevisiae.G3 (Bethesda). 2012 Sep;2(9):1129-36. doi: 10.1534/g3.112.003251. Epub 2012 Sep 1. G3 (Bethesda). 2012. PMID: 22973550 Free PMC article.
-
Delayed Turnover of Unphosphorylated Ssk1 during Carbon Stress Activates the Yeast Hog1 Map Kinase Pathway.PLoS One. 2015 Sep 4;10(9):e0137199. doi: 10.1371/journal.pone.0137199. eCollection 2015. PLoS One. 2015. PMID: 26340004 Free PMC article.
-
Osmostress-induced gene expression--a model to understand how stress-activated protein kinases (SAPKs) regulate transcription.FEBS J. 2015 Sep;282(17):3275-85. doi: 10.1111/febs.13323. Epub 2015 Jun 10. FEBS J. 2015. PMID: 25996081 Free PMC article. Review.
-
The HOG pathway and the regulation of osmoadaptive responses in yeast.FEMS Yeast Res. 2022 Mar 25;22(1):foac013. doi: 10.1093/femsyr/foac013. FEMS Yeast Res. 2022. PMID: 35254447 Free PMC article. Review.
Cited by
-
cDREM: inferring dynamic combinatorial gene regulation.J Comput Biol. 2015 Apr;22(4):324-33. doi: 10.1089/cmb.2015.0010. J Comput Biol. 2015. PMID: 25844671 Free PMC article.
-
Mediator phosphorylation prevents stress response transcription during non-stress conditions.J Biol Chem. 2012 Dec 28;287(53):44017-26. doi: 10.1074/jbc.M112.430140. Epub 2012 Nov 7. J Biol Chem. 2012. PMID: 23135281 Free PMC article.
-
Integrity and function of the Saccharomyces cerevisiae spindle pole body depends on connections between the membrane proteins Ndc1, Rtn1, and Yop1.Genetics. 2012 Oct;192(2):441-55. doi: 10.1534/genetics.112.141465. Epub 2012 Jul 13. Genetics. 2012. PMID: 22798490 Free PMC article.
-
The relative importance of transcription rate, cryptic transcription and mRNA stability on shaping stress responses in yeast.Transcription. 2012 Jan-Feb;3(1):39-44. doi: 10.4161/trns.3.1.19416. Transcription. 2012. PMID: 22456320 Free PMC article.
-
A Multi-Parameter Analysis of Cellular Coordination of Major Transcriptome Regulation Mechanisms.Sci Rep. 2018 Apr 10;8(1):5742. doi: 10.1038/s41598-018-24039-1. Sci Rep. 2018. PMID: 29636505 Free PMC article.
References
-
- Alepuz P.M., Jovanovic A., Reiser V., Ammerer G. Stress induced MAP kinase Hog1 is part of transcription activation complexes. Mol. Cell. 2001;7:767–777. - PubMed
-
- Bhattacharyya S., Habermacher R., Martine U., Closs E., Filipowicz W. Relief of microRNA-mediated translational repression in human cells subjected to stress. Cell. 2006;125:1111–1124. - PubMed
-
- Bond U. Stressed out! Effects of environmental stress on mRNA metabolism. FEMS Yeast Res. 2006;6:160–170. - PubMed
Publication types
MeSH terms
Substances
LinkOut - more resources
Full Text Sources
Molecular Biology Databases
